Have you ever wondered how traders predict when the market might reverse? One tool experienced traders use is ICT CISD, which stands for “Change in the State of Delivery.” In simple terms, it helps us see when the control of price might shift from buyers to sellers or the other way around.
What is ICT Change in the State of Delivery?
ICT CISD is all about spotting a change in how the price is moving in the market. Imagine the price has been going up because buyers are in control. After an ICT CISD occurs, sellers might take over, and the price could start to go down. This shift can act as a confirmation to enter a trade, especially when looking at higher time frames. It’s like getting an early signal before a big market move happens.
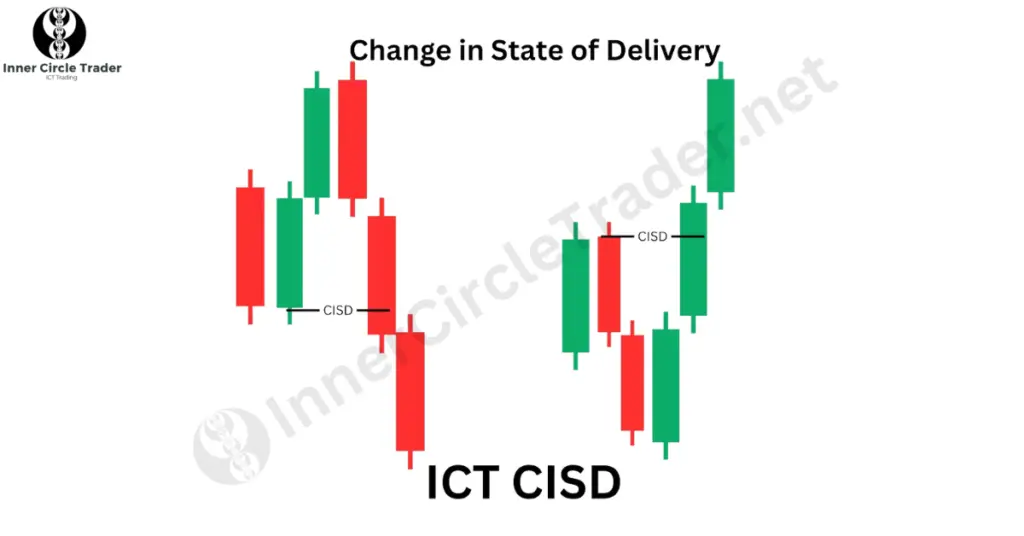
How to Spot an ICT CISD on the Chart
To find an ICT CISD on your chart, you need to look at how the candles are closing compared to how they opened. Here’s how you can do it:
Bullish ICT CISD (Expecting Price to Go Up)
- Look for one or more bearish candles (candles that closed lower than they opened).
- Ignore the thin lines (wicks) above and below the candle body; focus on where the candle opened and closed.
- If a candle closes above the opening price of the previous bearish candle(s), it suggests that selling momentum is weakening. This could mean buyers are gaining strength, and the price might start to rise.
- The previous bearish candles can act as a support area, helping the price move up.
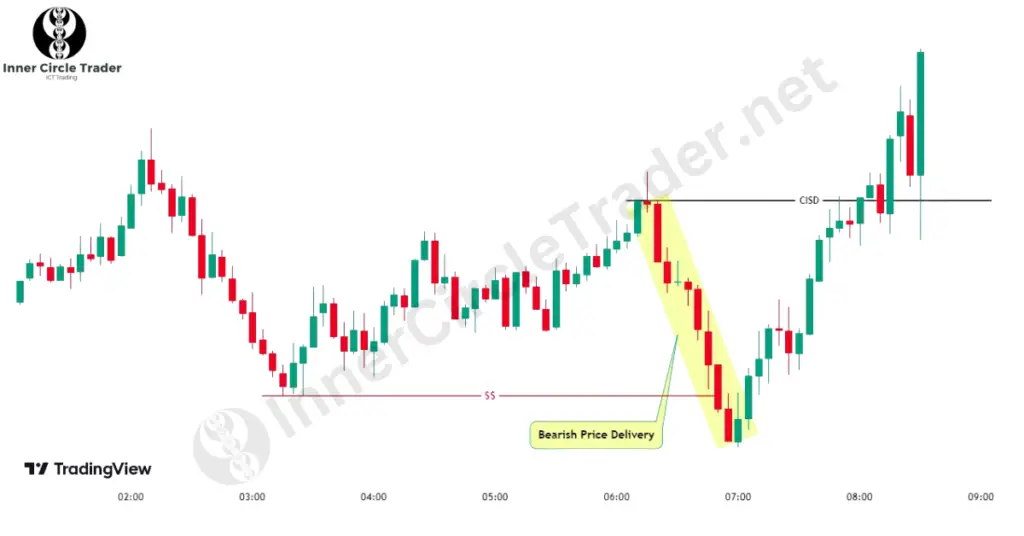
Bearish ICT CISD (Expecting Price to Go Down)
- Look for one or more bullish candles (candles that closed higher than they opened).
- Again, focus on the opening and closing prices, not the wicks.
- If a candle closes below the opening price of the previous bullish candle(s), it indicates that buying momentum is fading. This could mean sellers are taking control, and the price might start to fall.
- The previous bullish candles can act as a resistance area, pushing the price down.
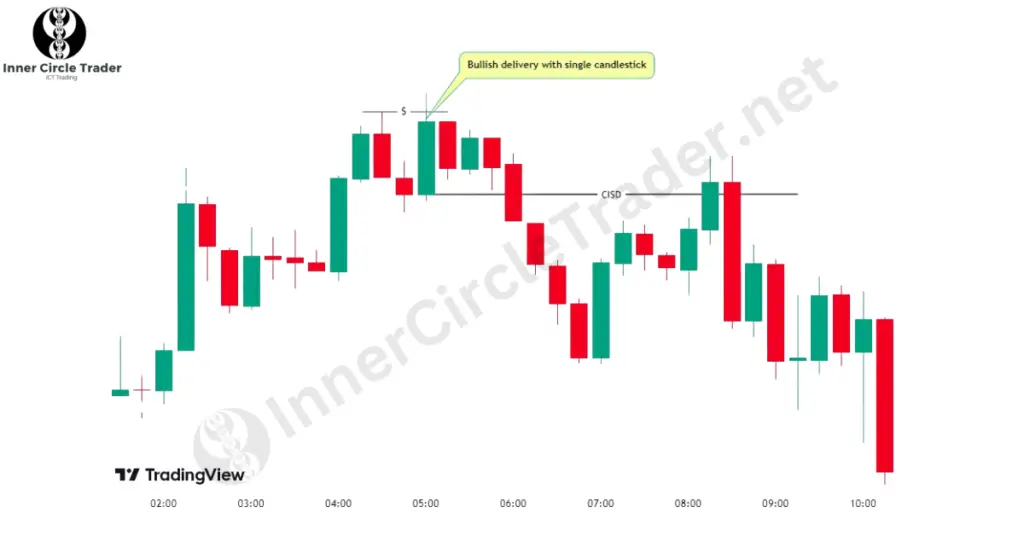
ICT CISD vs. ICT MSS
While both ICT CISD and ICT MSS help us predict market reversals, they look at different things:
- Market Structure Shift (MSS): This focuses on bigger trend changes in the market. It looks for the price to break important highs or lows to confirm a trend change from bullish to bearish or vice versa.
- Change in the State of Delivery (CISD): This looks at the strength of buying or selling by checking if prices are closing above or below the openings of previous candles.
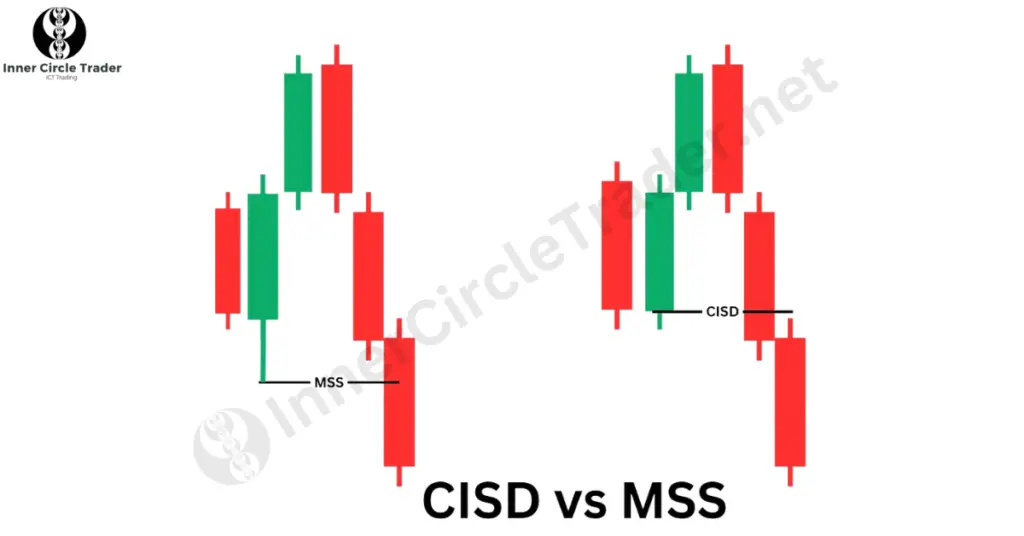
Timing and Confirmation
- CISD gives earlier signals but might sometimes be false alarms.
- MSS provides stronger confirmation but might signal the change after the initial move has started.
Think of MSS as looking at the big picture, while CISD zooms in on the details. Using both together can give you a better view of what’s happening in the market.
Conclusion
Understanding ICT CISD can give you an edge in trading by helping you spot early signs of market reversals. By focusing on how prices are delivered and paying attention to candle closures, you can make more informed decisions. Remember to use CISD alongside other analysis tools and always manage your risk carefully.
Frequently Asked Questions (FAQs):
ICT CISD stands for “Change in the State of Delivery.” It refers to a shift in the way the price moves from buyers being in control to sellers taking over, or vice versa. Traders use it to identify potential reversals in the market.
By spotting a CISD on your chart, you can get early signals of a potential market reversal. This can help you enter or exit trades at better prices. It’s especially useful when combined with other tools like Market Structure Shift (MSS) and proper risk management.
While both are used to predict market reversals, ICT CISD focuses on changes in momentum by looking at how candles close compared to their openings. ICT MSS looks at the overall trend by tracking breaks of major highs or lows. CISD gives earlier signals, while MSS provides stronger confirmation.
When looking for a CISD, we focus on the opening and closing prices because they show the real buying and selling activity during that period. The wicks represent price extremes but not where the price settled, so they are less important for this analysis.
Yes, since CISD provides early signals, there’s a chance of false reversals. To manage this risk, it’s important to use CISD alongside other confirmation tools like MSS and to practice good risk management, such as setting stop-loss orders and not over-leveraging your trades.
