Understanding how price charts signal a change in direction is one of the most valuable skills a trader can have. The Quasimodo (QML) chart pattern is a special formation that suggests a trend might soon reverse. This pattern often appears near important support or resistance areas on higher time frames. When it shows up at these key levels, it can help traders recognize when the market is about to shift from bullish to bearish, or from bearish to bullish. For traders who are familiar with simple price action concepts, the QML pattern can be an effective way to spot new trading opportunities and time their trades more accurately.
What is the QML (Quasimodo) Pattern?
The QML pattern is a type of reversal pattern that traders watch for when a trend may be losing momentum. In a bullish trend, the market is making higher highs and higher lows. In a bearish trend, it is making lower lows and lower highs. The QML pattern forms when this usual sequence breaks. For example, in a bearish trend, a QML pattern appears when the price makes a lower low, then suddenly creates a higher high. This change in behavior can mean that sellers are no longer fully in control and that buyers might be ready to push the price up. In a bullish trend, it is the opposite. You might see a higher high followed by a lower low, signaling that buyers may be losing strength and sellers could soon take over.
Identifying a Bullish QML Pattern
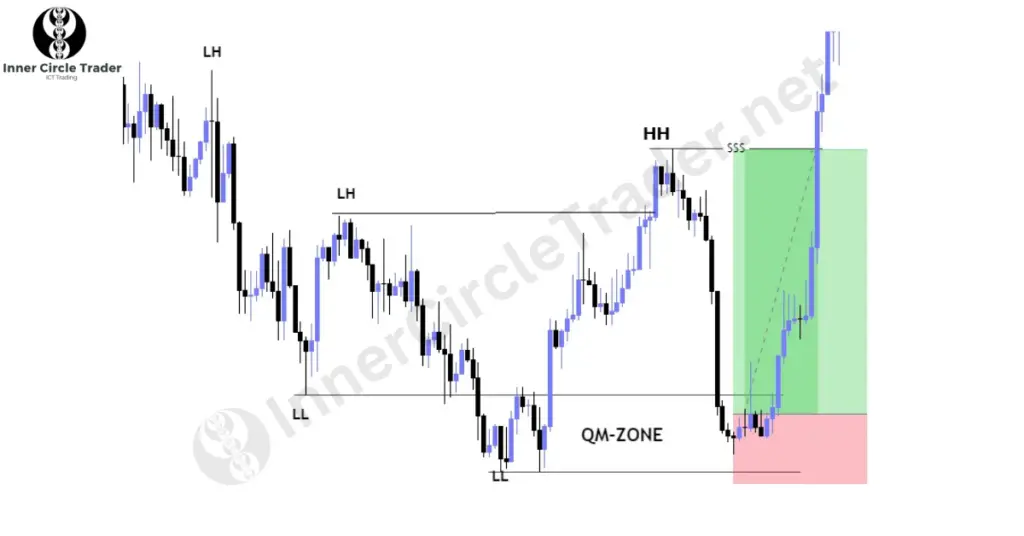
A bullish QML pattern often shows up after a long period of falling prices. As the price moves down, it keeps making lower highs and lower lows. Eventually, it reaches a strong support level, a point where buyers start to push back. Here, the price creates a new high that is higher than the previous lower high. By doing so, it breaks the normal downward pattern. This sudden shift suggests that the downtrend might be ending and that an uptrend could be about to begin.
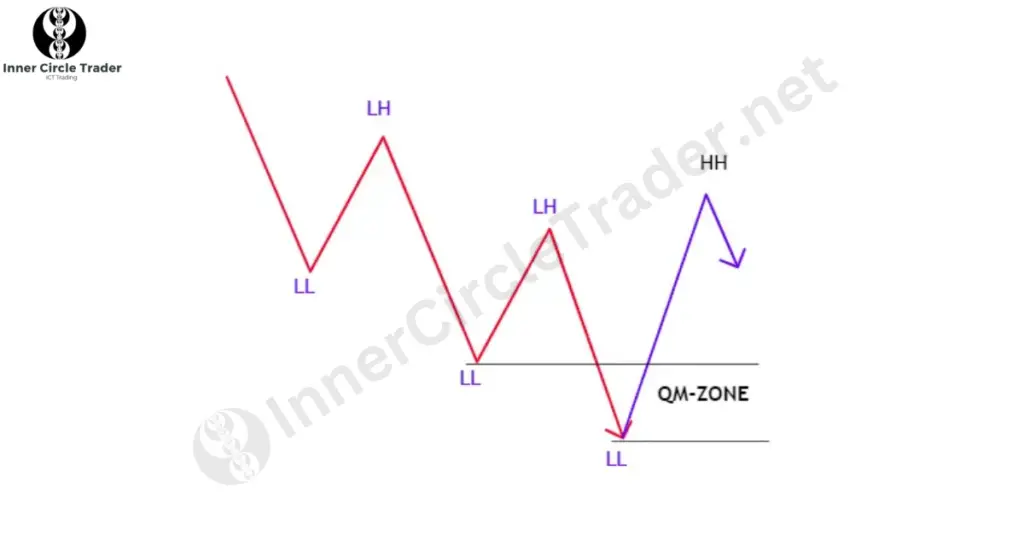
To trade a bullish QML pattern, many traders wait for the price to return to the area where it just made that higher high. This area, often found between the last two lows before the pattern formed, can serve as a zone of renewed buying interest. Traders look for signs that buyers are stepping in again, and once they see those signs, they enter a buy trade. They place a stop-loss order just below the last low to protect themselves in case the market turns against them. Their profit target is often set around the recent high, where the QML pattern suggested a potential trend change.
Identifying a Bearish QML Pattern
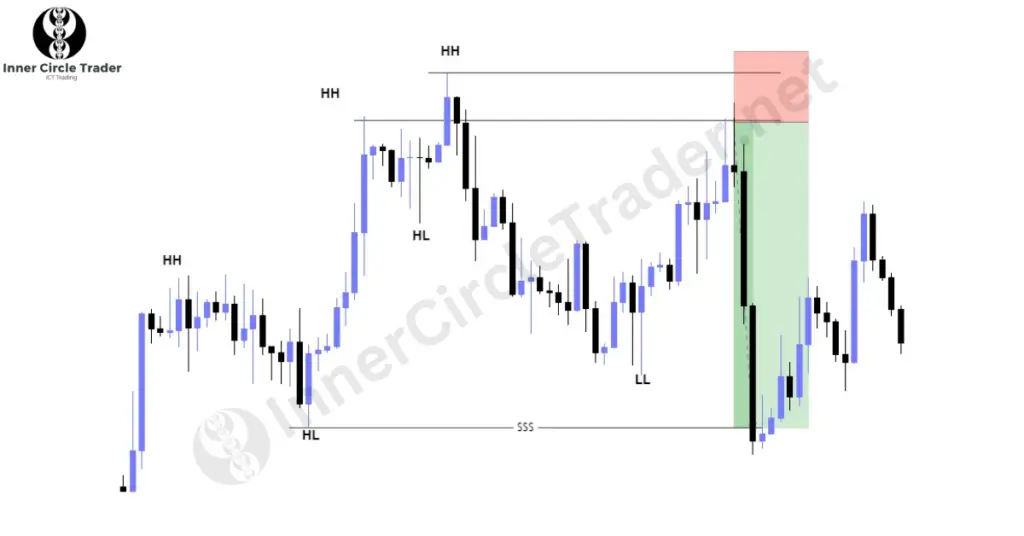
A bearish QML pattern is basically the opposite scenario. It usually appears after a long period of rising prices, where the market has been making higher highs and higher lows. At some point, the price reaches a strong resistance level and struggles to go higher. Then it prints a new low that is lower than the previous higher low. This break in the upward pattern signals that the buyers may be losing control and that a downward move could be just around the corner.
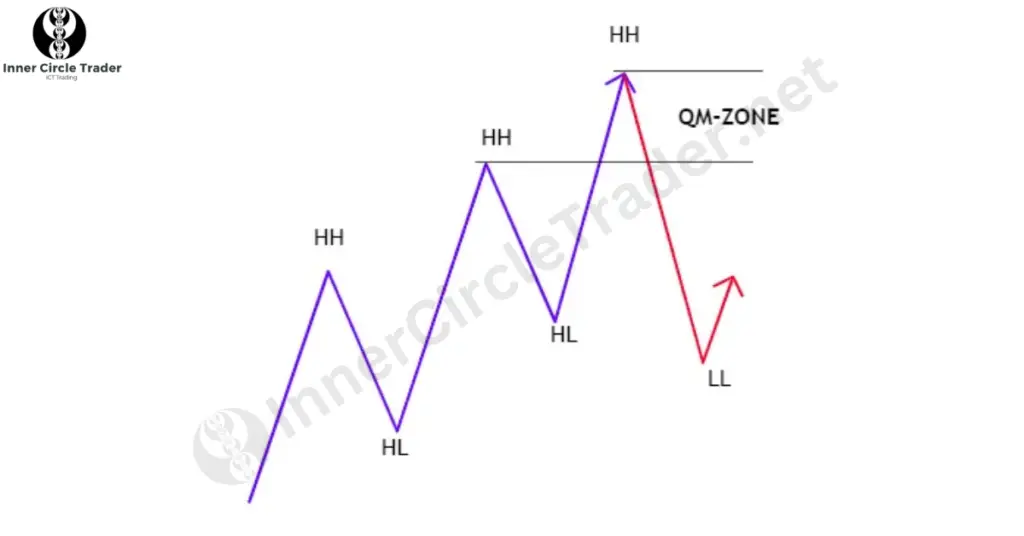
To trade a bearish QML pattern, traders often wait for the price to return to the zone where it made the lower low. This area, found between the last two highs before the pattern formed, can be a spot where sellers decide to step in again. If they see signs of selling pressure returning, traders may open a sell trade. They set a stop-loss order just above the last high to manage their risk, and they aim for a profit target around the recent low that signaled the potential trend reversal.
Understanding the Basis of QML Patterns
The QML pattern is related to a concept known as a change of character, or CHOCH. A CHOCH occurs when the price breaks a key point in the market’s structure, such as a lower high in a downtrend or a higher low in an uptrend. It signals that the trend may be shifting. What makes the QML pattern special is that it can sometimes warn traders of a possible trend reversal before a clear structural break occurs. By learning to recognize QML patterns, traders can sometimes spot changes in market behavior earlier than those who focus only on traditional chart patterns. This ability to see potential reversals sooner can give traders a valuable edge.
Frequently Asked Questions (FAQs)
The QML pattern is based on simple ideas: the market is either going up or going down, and the QML shows when this rhythm might be breaking. Because it is built on basic concepts of highs and lows, it feels straightforward, even for beginners.
Most traders rely on basic price charts and support and resistance levels to spot QML patterns. While some may use extra tools to confirm their trades, it is not required. The pattern itself is clear enough for many traders to make informed decisions without fancy indicators.
Yes, the QML pattern works on many different markets and time frames. It appears in forex, stocks, commodities, and cryptocurrencies. While some traders prefer higher time frames for more reliable signals, the core idea of the pattern remains the same no matter what market or time frame you choose.
Many traders look for additional clues, such as how the price behaves when it returns to the QML zone or whether the market shows signs of strong buying or selling pressure. Some traders also wait for a smaller time frame signal, like a simple break of a minor high or low, before taking the trade.
No pattern works every single time. While the QML pattern can be a good sign that a trend may be changing, nothing is guaranteed. Market conditions can vary, and sometimes the price may not reverse even after a QML pattern forms. That is why risk management and careful trade planning are always important.
