If you’re looking to improve your trade entries and get better prices in the market, the ICT PD Array Matrix might be just what you need. This method helps traders identify optimal buying and selling points by analyzing price movements in a simple yet effective way. In this article, we’ll break down what the ICT PD Array Matrix is, how to identify it, and how you can use it to enhance your trading strategy.
What Is the ICT PD Array Matrix?
The ICT PD Array Matrix stands for “Premium and Discount Arrangement.” It’s a tool used by traders to find the best prices for entering or exiting trades. Essentially, it helps you determine when the market is offering you a good deal.
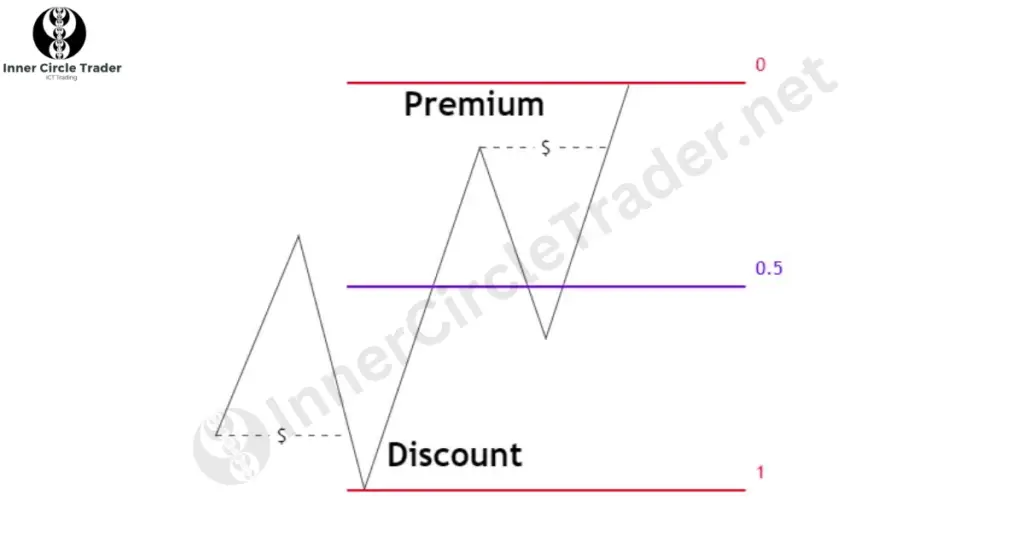
As traders, we aim to buy low and sell high. The PD Array Matrix assists in identifying these opportunities by categorizing price areas into premium (expensive) and discount (cheap) zones. By using this matrix, you can increase your chances of buying at lower prices and selling at higher ones.
How to Identify the ICT PD Arrays
To find the premium and discount zones, we’ll use a tool called the Fibonacci retracement. Here’s how you can do it:
- Select Significant Highs and Lows: Look for an old high and an old low on your price chart. These points represent significant price levels in the market.
- Draw the Fibonacci Retracement: Use the Fibonacci tool to draw from the old high down to the old low. This will create levels on your chart that represent different percentages of the price range.
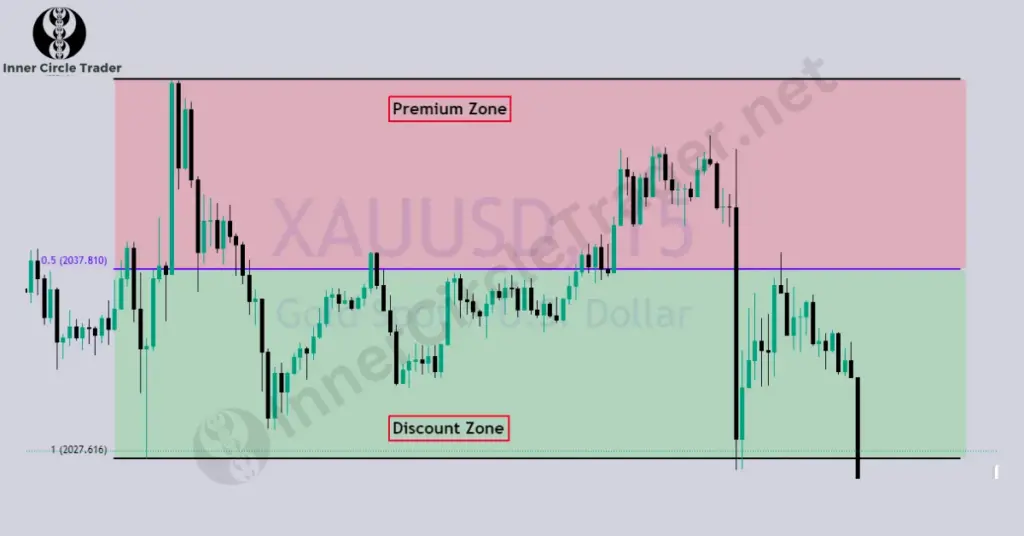
- Focus on the 50% Level: The 50% retracement level, also known as the equilibrium, is the midpoint between the high and low. It’s a crucial level in identifying premium and discount zones.
- Above 50% (Premium Zone): Prices above this level are considered expensive. This is typically where sellers are interested in entering the market.
- Below 50% (Discount Zone): Prices below this level are considered cheap. This is where buyers are likely to step in.
By identifying these zones, you can better understand where to look for buying or selling opportunities.
Bullish PD Arrays
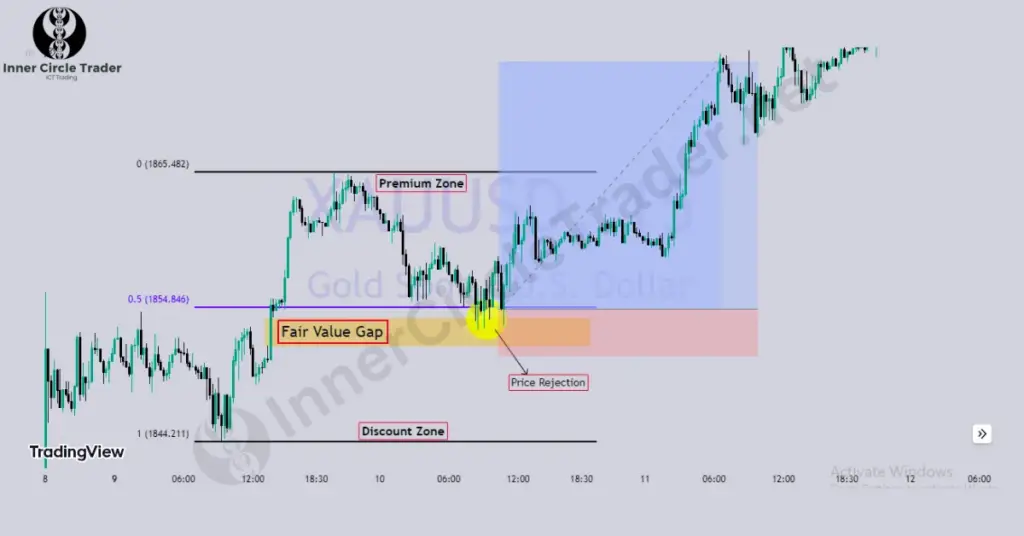
When you believe the market is going to rise, you’ll look for bullish PD Arrays in the discount zone. These are signals that the price is low and may soon increase. Examples of bullish PD Arrays include:
- Fair Value Gaps
- Order Blocks
- Breaker Blocks
- Mitigation Blocks
- Inverse Fair Value Gaps
- New Day Opening Gaps (NDOG)
- New Week Opening Gaps (NWOG)
- The ICT Unicorn Model
If you spot several of these signals in the discount zone, it could be a strong indication to consider buying.
Bearish PD Arrays
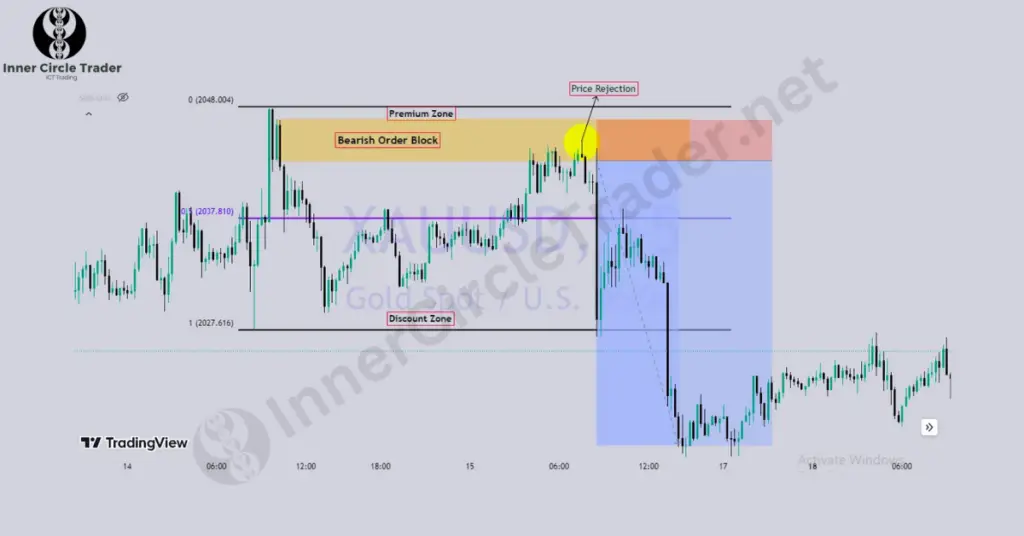
Conversely, when you expect the market to fall, you’ll look for bearish PD Arrays in the premium zone. These signals suggest that the price is high and may soon decrease. Examples of bearish PD Arrays include:
- Fair Value Gaps
- Order Blocks
- Breaker Blocks
- Mitigation Blocks
- Inverse Fair Value Gaps
- New Day Opening Gaps (NDOG)
- New Week Opening Gaps (NWOG)
- The ICT Unicorn Model
Seeing multiple bearish signals in the premium zone might be a cue to consider selling.
How to Use ICT PD Arrays in Your Trading
The PD Array Matrix can help you in two main ways:
- Determining Market Bias
- Bullish Bias: If the market structure has shifted upward and prices are in the discount zone, you might look for opportunities to buy.
- Bearish Bias: If the market structure has shifted downward and prices are in the premium zone, you might look for opportunities to sell.
- Finding Trade EntriesOnce you’ve established your market bias, you can zoom into lower time frames to find precise entry points.
- For Buying: If you’re bullish and prices are in the discount zone, look for bullish PD Arrays on lower time frames to time your entry.
- For Selling: If you’re bearish and prices are in the premium zone, look for bearish PD Arrays on lower time frames to time your entry.
By aligning your overall market view with specific entry signals, you increase the likelihood of a successful trade.
Best Time Frames to Use
- Determining Bias: The daily chart (1-day time frame) is ideal for understanding the overall market direction.
- Finding Entries: Lower time frames like the 15-minute and 5-minute charts are useful for pinpointing exact entry and exit points.
Best Trading Pairs for ICT PD Arrays
Originally, the ICT PD Array Matrix was used on indices like NASDAQ (NQ Futures) and the E-mini S&P 500. However, traders have found it effective on major forex pairs such as GBP/USD and EUR/USD, as well as commodities like gold (XAU/USD). This versatility makes it a valuable tool across different markets.
Final Thoughts
The ICT PD Array Matrix is a powerful method for identifying optimal trade entries and exits. By understanding premium and discount zones, you can make more informed trading decisions. Remember, no strategy is foolproof. Always practice good risk management by using stop losses and not risking more than you can afford to lose.
FAQs About ICT PD Array Matrix:
The ICT PD Array Matrix stands for “Inner Circle Trader Premium and Discount Arrangement.” It’s a method used to identify optimal buying and selling zones in the market by categorizing price areas into premium (expensive) and discount (cheap) zones.
You select an old high and an old low on your chart and draw the Fibonacci retracement from the high to the low. The key level is the 50% retracement, which separates the premium zone (above 50%) from the discount zone (below 50%).
Yes, while it was initially used on indices like NASDAQ and S&P 500, the ICT PD Array Matrix can be applied to forex pairs like GBP/USD and EUR/USD, as well as commodities like gold.
Use the daily chart to determine your overall market bias (bullish or bearish). Then, use lower time frames like the 15-minute or 5-minute charts to find precise trade entries and exits.
It’s recommended to use the ICT PD Array Matrix in conjunction with other trading strategies and risk management practices. Combining it with methods like the ICT 2022 Model or the Silver Bullet strategy can enhance your trading effectiveness.
