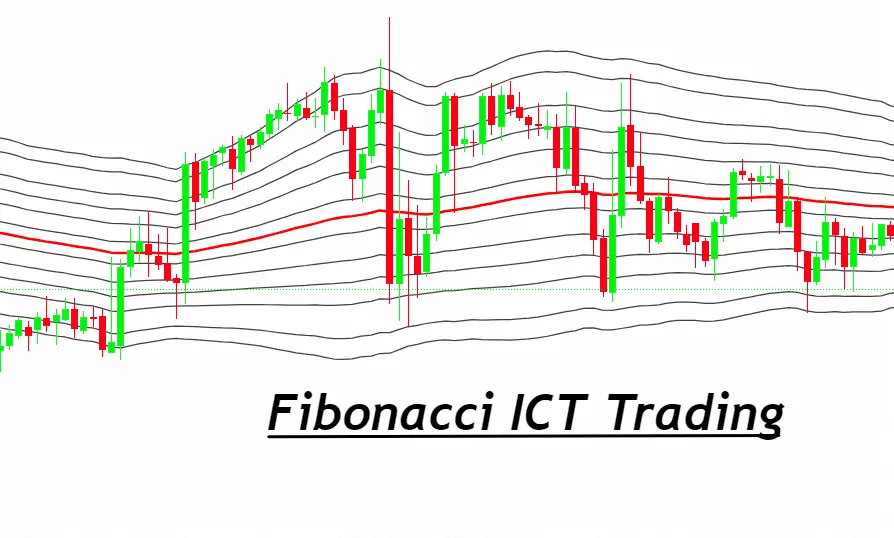
Introduction to Fibonacci ICT
Fibonacci ICT is a fascinating concept that starts with the Fibonacci sequence. This sequence is a list of numbers where each number is the sum of the two before it. It begins with 0 and 1. So, it goes like this: 0, 1, 1, 2, 3, 5, 8, 13, and it keeps going. An Italian mathematician named Leonardo of Pisa, also known as Fibonacci, introduced this sequence in his book “Liber Abaci” back in 1202. He used it to explain how rabbits breed, but it turned out to be much more important than that.
Now, you might wonder why we’re talking about rabbits in trading. Well, this sequence isn’t just a neat mathematical trick; it’s incredibly useful in many areas, including trading, computer science, and even nature. In trading, the Fibonacci sequence helps traders make decisions. It does this through something called Fibonacci levels, which are like invisible lines that predict where prices might go. These levels can help traders figure out the best times to buy or sell. So, from the way trees branch out to the way traders pick their moments, the Fibonacci sequence is everywhere, showing us how interconnected math is with the world around us.
What are ICT Fibonacci levels
ICT Fibonacci levels are important tools in trading. They help traders predict price movements. Here’s a closer look at some key levels:
- 0: This is the starting point, where traders might take some profits off the table. It’s called “First Profit Scaling.”
- 0.505: Known as the Equilibrium level, it represents a 50% price retracement. Traders see this as a balance point.
- 0.618: This level, 62% Retracement, is crucial. It signals a strong chance the price will bounce back.
- 1.0: The 100% mark means prices have returned to their original position. It’s a full circle moment for traders.
- 0.705: The Optimal Trade Entry, or OTE, is a sweet spot for entering trades. It offers a good risk-reward ratio.
- 0.79: At 79% Retracement, this level suggests another opportunity for prices to reverse.
- -0.62 and -0.27: These are targets, labeled as Target 2 and Target 1. Traders aim for these levels to take profits.
- -1: The Symmetrical Price level. It indicates prices have moved in a mirror image of their initial path.
Each level serves as a guide for making trade decisions, showing where and when to enter or exit trades.
Setting Up ICT Fibonacci Levels
To set up ICT Fibonacci levels on TradingView, you’ll follow a few straightforward steps. This process will tailor your trading charts to better fit ICT trading strategies, highlighting potential entry and exit points that align with these specialized levels. Here’s a more detailed breakdown:
- Open TradingView: Start by navigating to your TradingView account. Make sure you have your trading chart open for the market you want to analyze.
- Find the Fibonacci Retracement Tool: On the TradingView platform, look for the drawing toolbar on the left side of the chart. The Fibonacci retracement tool is usually represented by an icon that looks like a zigzag or a percentage symbol. If you can’t find it immediately, it might be nested under another tool, so explore the options available.
- Place the Fibonacci Tool on the Chart: To do this, click on the Fibonacci retracement tool icon, then click and drag from a significant swing high to a significant swing low on the chart for a downtrend, or vice versa for an uptrend. The “swing high” is a peak where prices turned lower, and the “swing low” is a trough where prices turned higher. This action draws the initial Fibonacci levels automatically based on the range you selected.
- Adjust the Fibonacci Levels: Now, double-click on the line created by the Fibonacci tool to make it active. Then, right-click on it to access its settings or properties. Look for an option that says “Fib levels,” “Fibonacci levels,” or something similar. This is where you can add or adjust levels.
- Customize the ICT Levels: In the settings menu, you will need to input the specific ICT Fibonacci levels. You might have to add new levels by entering the level value (like 0.505, 0.618, 0.705, etc.) and labeling them accordingly (e.g., “Equilibrium,” “62% Retracement”). Make sure to include all the relevant ICT levels such as:
- 0 (First Profit Scaling)
- 0.505 (Equilibrium)
- 0.618 (62% Retracement)
- 1.0 (Original position)
- 0.705 (Optimal Trade Entry or OTE)
- 0.79 (79% Retracement)
- Negative levels like -0.62 (Target 2), -0.27 (Target 1), and -1 (Symmetrical Price) for price objectives beyond the initial range.
- Save Your Settings: After you’ve added and labeled all the necessary ICT Fibonacci levels, make sure to save your settings. This usually involves clicking a “Save” or “OK” button. Your chart will now display the adjusted Fibonacci levels, tailored to the ICT trading methodology.
- Apply and Analyze: With your ICT Fibonacci levels set up, you can now use them to analyze market movements and make informed decisions. These levels will help you identify potential Optimal Trade Entry (OTE) points, as well as profit targets and areas for placing stop-loss orders.
By customizing the Fibonacci levels on your TradingView chart to include ICT-specific levels, you enhance your ability to spot high-probability trading setups based on the ICT methodology. This setup not only aids in planning entry and exit strategies but also in managing risk and maximizing potential returns.
Applying ICT Fibonacci Settings on Charts
Applying ICT Fibonacci settings on charts is all about finding the right spots to draw your Fibonacci retracement levels, especially in different market conditions like bullish or bearish trends. Here’s a simple guide on how to do it:
- Identify the Market Trend: First, figure out if the market is moving up (bullish) or down (bearish). This is crucial because it determines where you start and end your Fibonacci retracement tool.
- For a Bullish Market: If prices are going up, you want to place the Fibonacci tool at the bottom of the trend and drag it to the top. This means you start at a low point where prices began to rise and drag the tool up to the most recent high point.
- For a Bearish Market: If prices are falling, you do the opposite. Start at the top of the trend where prices began to fall and drag the tool down to the most recent low point.
- Use Candle Bodies: Instead of using the very peaks or bottoms of the candlesticks (the highs and lows), focus on the bodies of the candles. The body is the thicker part that shows the opening and closing prices. This approach is more reliable because the highs and lows can vary a lot between different brokers or charts, but the body gives you a more consistent reference point.
- Drawing the Tool: Click on the beginning point (based on your trend direction and using the candle body), then drag and release the tool at the end point (again, using the candle body of the high or low point). This action draws the Fibonacci levels automatically.
- Analyzing the Levels: Once drawn, the ICT Fibonacci levels on your chart will show potential areas of support or resistance. In a bullish trend, these levels can indicate where a pullback might pause and the price might start rising again. In a bearish trend, they can show where a rally might stop, and the price might start falling again.
- Making Trade Decisions: Use these levels to make informed decisions about when to enter or exit trades. The levels highlighted by the ICT Fibonacci settings, especially the Optimal Trade Entry (OTE) points, are considered strategic places to look for trade setups.
By applying these steps, you’re using the ICT Fibonacci settings to find better entry points based on how the market is moving and the candlestick bodies. This method helps you cut through the noise and focus on more reliable signals for your trading decisions.
Optimal Trade Entry (OTE) in ICT Trading
In ICT Trading, Optimal Trade Entry (OTE) is all about finding the perfect spots to enter a trade. It’s crucial because it helps traders minimize risks and maximize profits. Here’s a detailed look at OTE in ICT Trading:
Definition and Importance of OTE in ICT Trading
OTE is a key strategy. It points to the best moments to start a trade, aiming for high success. This is vital for managing money well and making smart moves in the market.
Identifying OTE Levels and Opportunities
To spot OTE levels, watch for special ICT Fibonacci levels, especially the 0.705 level. These points are like signals, showing where the market might turn. When you see prices hit these levels, it’s time to pay attention. These moments can lead to good chances to jump into a trade.
Combining Premium and Discount Concepts
Mixing OTE with premium and discount ideas makes your decisions sharper. It’s about looking beyond the basics. When prices are above or below what’s expected (premium or discount), it adds another layer to your strategy. This blend helps in picking entry points more wisely, boosting your chances for better outcomes.
In summary, OTE in ICT Trading is a powerful tool. It guides traders to enter the market at the most promising times. By keeping an eye on specific Fibonacci levels and using premium and discount concepts, traders can enhance their strategy. This approach leads to smarter, more informed trading decisions.
Risk Management with ICT Fibonacci Levels
Risk management is key in trading, and ICT Fibonacci levels can help a lot. Here’s how:
Setting Stop-Loss Orders
First, set stop-loss orders near ICT Fibonacci levels. This limits loss if the market moves unexpectedly. Place them just below these levels for buys, or above for sells.
Identifying Ideal Entry Points
Next, look for ideal entry points at certain Fibonacci levels, like 0.618 or 0.705. These spots often signal strong potential for market reversal or continuation.
Refining Entry Points
Then, refine your entry points. Choose levels that offer a good balance between risk and reward. This strategy helps in making smarter, safer trade decisions.
In short, using ICT Fibonacci levels for risk management involves strategic stop-loss placement, identifying the best entry points, and adjusting these points for the best risk-reward ratio. This approach makes trading decisions more informed and helps protect your investments.
Conclusion
ICT Fibonacci levels are a powerful tool for traders. They help in finding the best spots to enter and exit trades, manage risk, and aim for higher profits. By setting smart stop-loss orders, identifying the right entry points, and fine-tuning these decisions, traders can enhance their strategies. This approach not only protects their investments but also opens up opportunities for better returns. Understanding and using ICT Fibonacci levels can truly make a difference in trading success.
