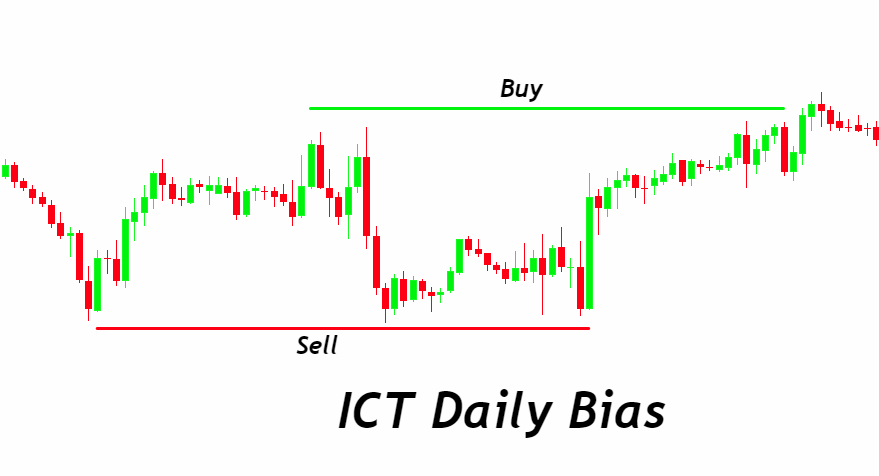
ICT Daily Bias is a strategic approach defined by its focus on interpreting daily market trends through the analysis of key elements such as sell-side and buy-side liquidity, fair value gaps, order blocks, volume imbalances, and recent highs and lows. This methodology is central to making informed trading decisions, offering a lens through which traders can discern the most opportune moments to enter or exit the market. By emphasizing the significance of understanding market liquidity, identifying value gaps, and analyzing trends, ICT Daily Bias simplifies complex trading concepts. This comprehensive strategy equips traders with the tools to navigate market movements with insight and precision. Integrating these critical aspects into your daily analysis fosters a well-rounded perspective on market dynamics, enabling a refined trading strategy that enhances your capacity for successful outcomes. With ICT Daily Bias as your compass, you’re guided to a more effective trading journey, empowered by a deepened understanding of daily market fluctuations and how they can influence your trading decisions. Embrace this approach for a nuanced and confident navigation of the trading landscape.
Fundamental Concepts of ICT Daily Bias
Delving into the fundamental concepts of ICT Daily Bias requires a comprehensive understanding of its three core elements: Liquidity Analysis, Fractality of Price Movement, and Utilizing Weekly Bias for Daily Analysis. These concepts form the backbone of the ICT Daily Bias strategy, enabling traders to navigate the market with more precision and foresight.
A. Liquidity Analysis
Liquidity Analysis is pivotal in understanding the flow and movement of the market. It involves two primary aspects:
- Identification of Liquidity Pockets Liquidity pockets are areas within the market where significant buy or sell orders accumulate. These areas are crucial for traders because they often indicate potential points of market reversal or acceleration. By identifying these pockets, traders can anticipate where the market is likely to move, providing opportunities for entry or exit. This approach is rooted in the observation of past and present market behavior, aiming to predict future movements by understanding where liquidity is likely to be drawn from or attracted to.
- Market Movement Dynamics This concept delves into how markets transition between different liquidity pockets, driven by the collective actions of participants responding to various factors such as economic data, geopolitical events, or technical levels. Understanding these dynamics is essential for traders to forecast the market’s direction. It involves recognizing the patterns of how liquidity is targeted and utilized, enabling traders to position themselves advantageously in anticipation of these movements.
B. Fractality of Price Movement
The fractality of price movement emphasizes the patterned nature of market prices across different timeframes, highlighting two key insights:
- Mirror Patterns Between Higher and Lower Timeframes Market movements exhibit fractal behavior, meaning patterns observed on larger timeframes (like weekly charts) often replicate on smaller timeframes (such as daily charts). This phenomenon allows traders to use insights gained from higher timeframe analysis to make predictions on lower timeframes, albeit with an understanding that the ‘noise’ or market volatility may increase as the timeframe decreases. Recognizing these mirrored patterns aids in aligning short-term trading strategies with the broader market trend.
- Price Disrespect on Lower Timeframes Although fractal patterns provide a roadmap for navigating market movements, lower timeframes can exhibit a higher degree of price volatility and deviation from established patterns. This ‘disrespect’ for the price indicates that while long-term trends provide a reliable context, short-term movements can be unpredictable and influenced by immediate market sentiments or news events. Traders need to be wary of this phenomenon, as it necessitates a more nuanced approach to managing risk and identifying trading opportunities.
C. Utilizing Weekly Bias for Daily Analysis
Incorporating a weekly market trend analysis into daily trading decisions underscores the importance of aligning short-term trades with the overarching market direction:
- Importance of Weekly Market Trend The weekly market trend offers a macroscopic view of market sentiment and direction, serving as a compass for daily trading activities. Understanding whether the market is predominantly bullish or bearish on a weekly basis can significantly influence daily trading strategies, encouraging traders to seek opportunities that align with the general trend.
- Focusing on Daily Opportunities Aligned with Weekly Trends By aligning daily trading activities with the broader weekly trend, traders can enhance their probability of success. This involves identifying specific opportunities on the daily chart that resonate with the weekly bias. For instance, in a weekly bullish trend, daily trading strategies might focus on identifying buy opportunities at points of value or retracements, thereby leveraging the momentum of the broader market trend for potential gains.
Developing ICT Daily Bias: Step-by-Step Approach
Creating an effective ICT Daily Bias involves a systematic approach that helps in making informed trading decisions. This method is designed to be straightforward, allowing both new and experienced traders to grasp and apply these concepts effectively. Let’s break down this approach into four manageable steps:
A. Step 1: D1 Timeframe Analysis
The first step is all about understanding the daily chart, which is a favorite among institutional traders for its clarity in showing market trends.
- Importance of the Daily Chart for Institutional Traders The daily chart (D1) is crucial because it reflects a comprehensive view of market movements, reducing the ‘noise’ seen in shorter timeframes. Institutional traders prefer this timeframe for its reliability in showcasing broader market trends, which are essential in making significant trading decisions.
- Marking Recent Swing Highs and Lows Begin by identifying and marking the most recent swing highs and lows on the daily chart. These points are critical as they offer insights into potential areas of support and resistance, helping predict future market directions. This marking should be updated at the start of each week to stay aligned with the latest market dynamics.
B. Step 2: Identifying Drawn-on Liquidity
The second step focuses on understanding market liquidity and its direction, a key factor in anticipating market movements.
- Algorithm Activity and Liquidity Direction Pay attention to recent algorithmic trading patterns and their impact on market liquidity. This involves observing whether recent activities favor buy-side or sell-side liquidity, influencing the general market direction.
- Anticipating the Next Drawn-on Liquidity Based on the observed algorithm activities, try to anticipate where the next significant liquidity pull might occur. This anticipation helps in preparing for potential market moves, whether they lead to a surge in buying or selling pressure.
C. Step 3: Premium and Discount Zones
This step involves analyzing the market’s position relative to its value, which helps in determining your trading stance.
- Determining the Bias Based on Price Zones Assess whether the current price is in a premium zone (indicating a potentially overvalued market) or a discount zone (where the market might be undervalued). If the price is above the 50% level, it suggests a premium zone, favoring short positions, and vice versa for the discount zone, suggesting potential long positions.
D. Step 4: Fair Value Gaps and Order Blocks
The final step deepens the analysis by integrating the concepts of fair value gaps and order blocks into your decision-making process.
- Substantiating Analysis with Additional Concepts Look for fair value gaps and order blocks as they can provide further evidence to support your trading decisions. Fair value gaps indicate areas where the price might move rapidly due to an imbalance in trading activity, while order blocks are areas where large orders are likely to influence the price direction. Identifying these elements can enhance the precision of your daily bias.
ICT Forex Essentials to Trading the Daily Bias
To effectively trade the daily bias using the ICT methodology, it’s crucial to understand a set of fundamental concepts. These concepts are the building blocks of a robust trading strategy, providing traders with a deep insight into market dynamics and helping to pinpoint the most opportune moments to execute trades. Let’s delve into each of these essentials:
A. Liquidity
Liquidity refers to the availability of buy and sell orders in the market. High liquidity means there are plenty of orders, making it easier to enter or exit trades without significantly affecting the price. Understanding liquidity is crucial because it can indicate potential market movements. Traders look for liquidity pools, areas where orders are likely to accumulate, as targets for price movement.
B. Premium and Discount Zones
The market can be viewed in terms of premium and discount zones, which help traders determine whether it’s overvalued or undervalued at a given moment.
- Premium Zone: When the market price is in the premium zone, it suggests that prices may be too high, and a correction or reversal might be imminent. Traders might consider looking for opportunities to sell in anticipation of a price drop.
- Discount Zone: Conversely, when prices are in the discount zone, the market may be undervalued, indicating a potential upward movement. This could be a good opportunity for traders to buy.
C. Fair Value Gaps
Fair value gaps occur when there is a significant price movement in a short period, leaving a ‘gap’ in the market where little to no trading has occurred. These gaps are important because they often act as magnets for price, with the market moving back to ‘fill’ the gap. Identifying these gaps can provide strategic entry and exit points.
D. Order Blocks
Order blocks are areas on the chart where significant buy or sell orders are placed by large players, like institutions or banks. These blocks can influence the market direction when activated. Recognizing order blocks can help traders align their trades with the actions of these market movers, potentially leading to more successful trade outcomes.
E. Breaker Block
A breaker block is a concept related to order blocks but with a specific focus on the price area that breaks through a previous support or resistance level, then comes back to retest that level. These areas are significant because they often represent a shift in market sentiment and can provide high-probability entry points for traders.
Conclusion
In conclusion, trading with ICT Daily Bias offers a structured approach to navigating the forex market. By understanding and applying the essential concepts of liquidity, premium and discount zones, fair value gaps, order blocks, and breaker blocks, traders can significantly enhance their market analysis and trading decisions. These fundamentals not only aid in identifying the most opportune moments to enter and exit trades but also in aligning one’s strategy with the underlying market dynamics. Whether you’re a novice or an experienced trader, incorporating ICT Forex Essentials into your trading routine can provide you with a clearer perspective on the market, leading to more informed decisions and potentially more successful trading outcomes. Remember, the key to mastering the market lies in continuous learning and applying these strategic concepts with discipline and patience.
