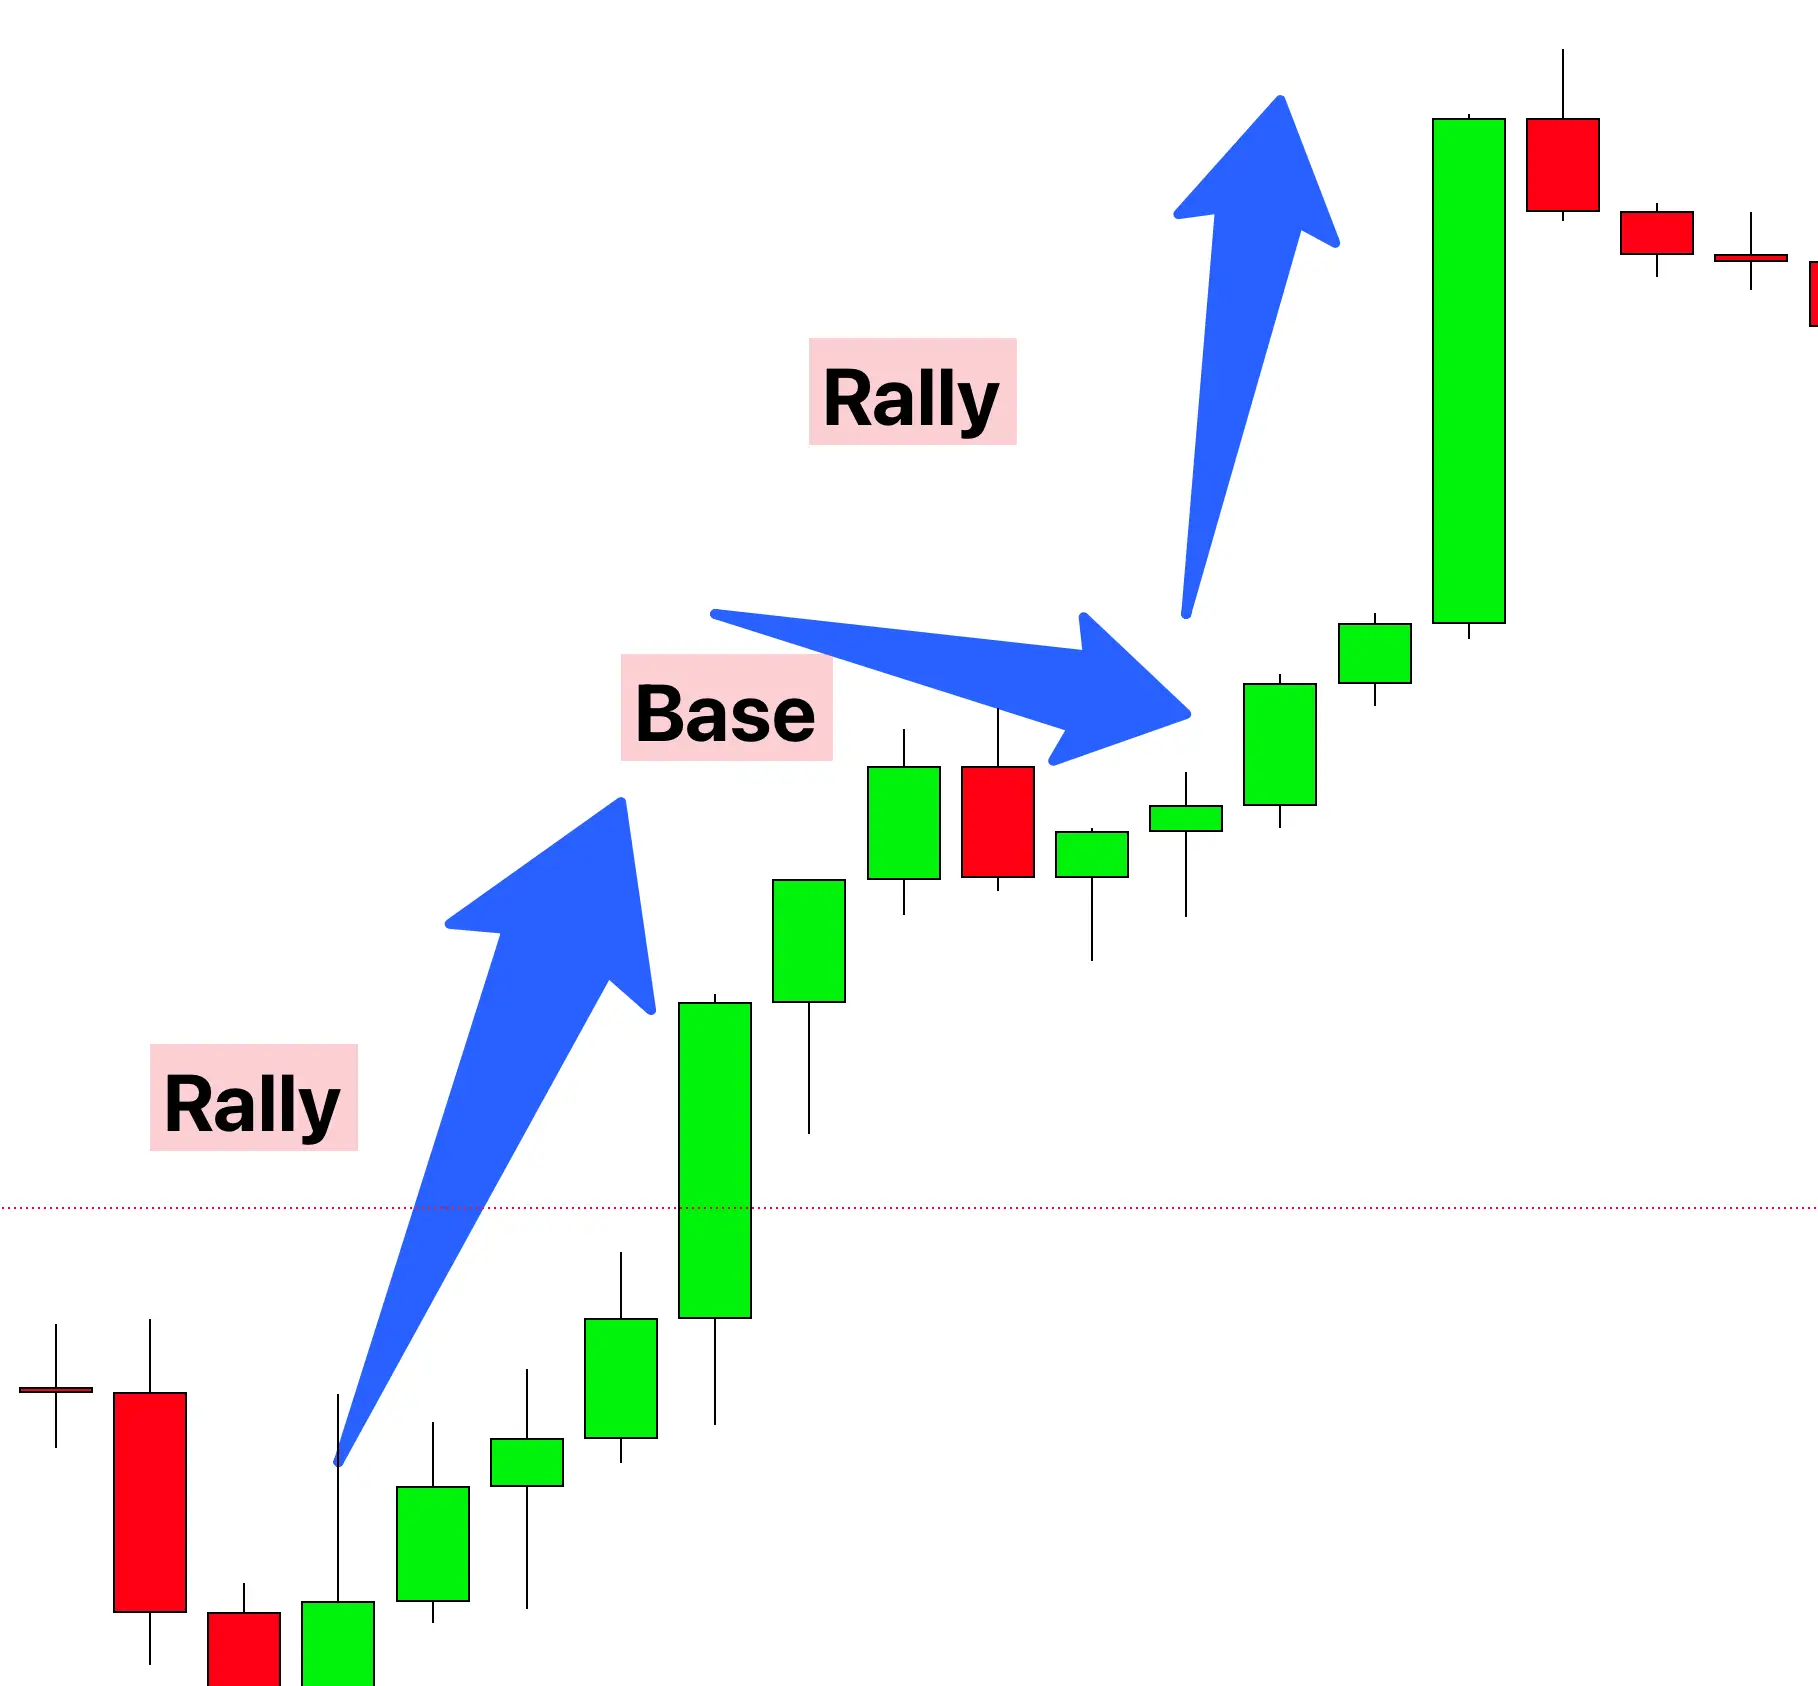
Rally Base Rally (RBR) is a price action pattern in trading that is used to identify potential areas of strong demand in a market. It is primarily observed in technical analysis and is characterized by three distinct phases:
- Rally: The first phase is marked by a significant upward price movement, indicating strong buying pressure. This rally shows that buyers are in control, pushing the price higher.
- Base: Following the rally, the price enters a consolidation phase, where it moves sideways. This period is characterized by a relative balance between buyers and sellers. The base indicates a pause in price movement, suggesting that the market is absorbing and evaluating the recent price surge.
- Rally Again: The pattern is completed with another upward price movement, similar to the initial rally. This second rally phase suggests that buying pressure has resumed and that the initial upward trend is continuing.
Step-by-Step Guide to RBR Trading
- Spotting the Rally: Watch for a strong price increase. This is your first rally.
- Identifying the Base: Look for a period where the price stabilizes, moving sideways. This consolidation suggests a balance between buyers and sellers.
- Confirming the Second Rally: The second rally, a price rise following the base, confirms the RBR pattern. This is your signal for a potential long position.
- Entry and Exit Points: Enter the trade at the start of the second rally. Set your exit strategy based on profit targets or stop-loss orders to manage risks.
- Combining RBR with Other Tools: For better results, pair RBR with other technical analysis tools. This combination can refine your entry and exit decisions.
Understanding Supply and Demand in Trading
To fully appreciate the nuances of the Rally Base Rally (RBR) pattern in trading, it’s essential to first understand the core principles of supply and demand.
- Supply: This refers to the quantity of a specific asset available in the market. A high supply typically suggests that there are plenty of the asset available for trading.
- Demand: Demand represents the buyers’ willingness and eagerness to purchase an asset. High demand indicates a strong interest in acquiring the asset.
The interaction between supply and demand is a fundamental driving force in the financial markets. It’s this push and pull dynamic that primarily influences price movements.
- Price Movements: When supply exceeds demand, there is usually a surplus of the asset in the market, leading to a decrease in its price. Conversely, when demand outstrips supply, the scarcity of the asset tends to drive its price upwards.
The Psychology Behind the RBR Pattern
Understanding the psychological underpinnings of the RBR pattern is crucial for its effective application in trading strategies.
- First Rally Phase: This phase is characterized by a sharp price movement, signaling a strong market interest (either demand or supply) in a particular direction. This rally is often driven by an influx of traders responding to perceived value, market news, or other influencing factors.
- Base Phase: The base, or consolidation phase, reflects a period of market indecision. During this phase, the prices stabilize as traders are evaluating whether the asset’s price will continue in the direction of the initial rally. This phase represents a psychological balancing act between buyers and sellers, assessing the asset’s fair value.
- Second Rally Phase: The subsequent rally is a critical psychological indicator. It suggests that the market has reached a consensus, agreeing with the direction of the initial rally. This phase indicates a renewed and confirmed interest, pushing the price further in the same direction.

Case Study: GBP/CAD 15-Minute Timeframe – Rally Base Rally (RBR) Structure
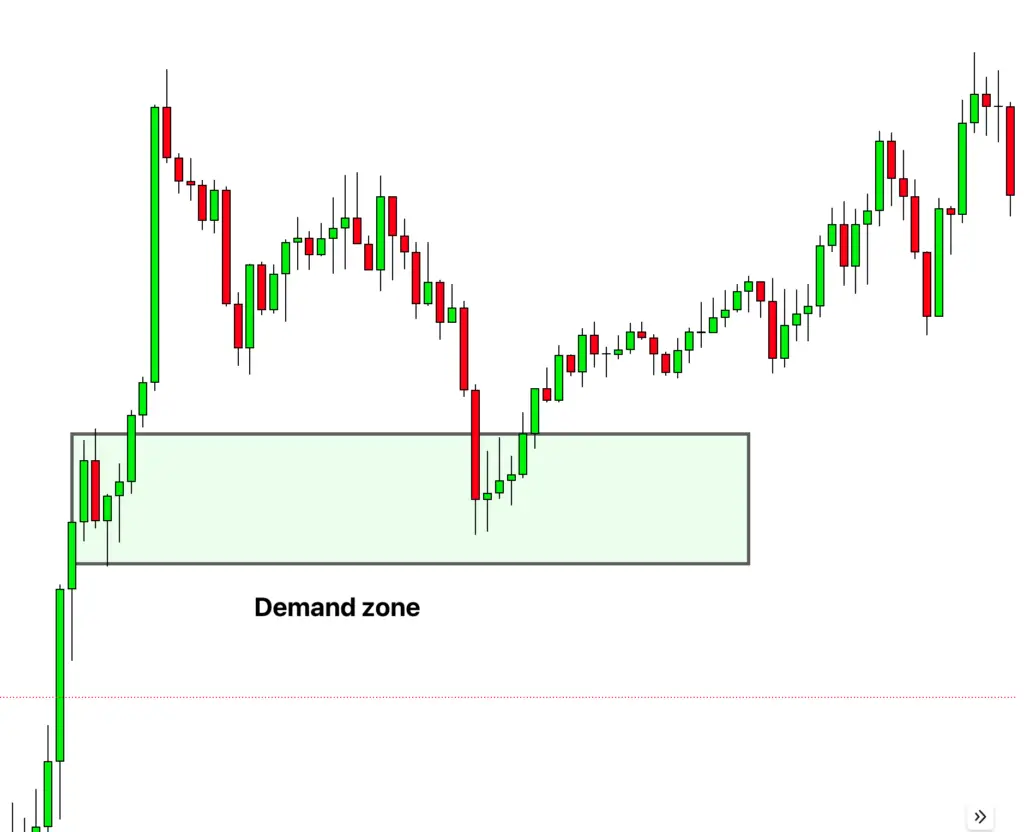
This case study focuses on the GBP/CAD currency pair in a 15-minute timeframe, where a significant impulsive wave exhibited a distinct Rally Base Rally (RBR) structure. The study aims to understand the underlying market psychology of the RBR pattern, particularly how supply and demand dynamics played a role in this scenario.
Understanding Supply and Demand in Trading
In trading, supply and demand fundamentally dictate price movements. Supply refers to the quantity of an asset available, while demand indicates buyers’ readiness to purchase. When supply outweighs demand, prices typically fall, and vice versa. This interplay is crucial in understanding the RBR pattern.
The Market Scenario
- Initial Impulsive Wave:
- A sharp movement in the GBP/CAD pair marked the beginning of our analysis. This impulsive wave is essential in setting the context for the RBR pattern.
- RBR Structure Formation:
- Within this wave, an RBR structure was identified. It started with a rapid price increase (first rally), transitioned into a stable phase (base), and concluded with another price increase (second rally).
- A demand zone was identified at the base phase, signaling a strong buying interest.
- Market Reversal to the Demand Zone:
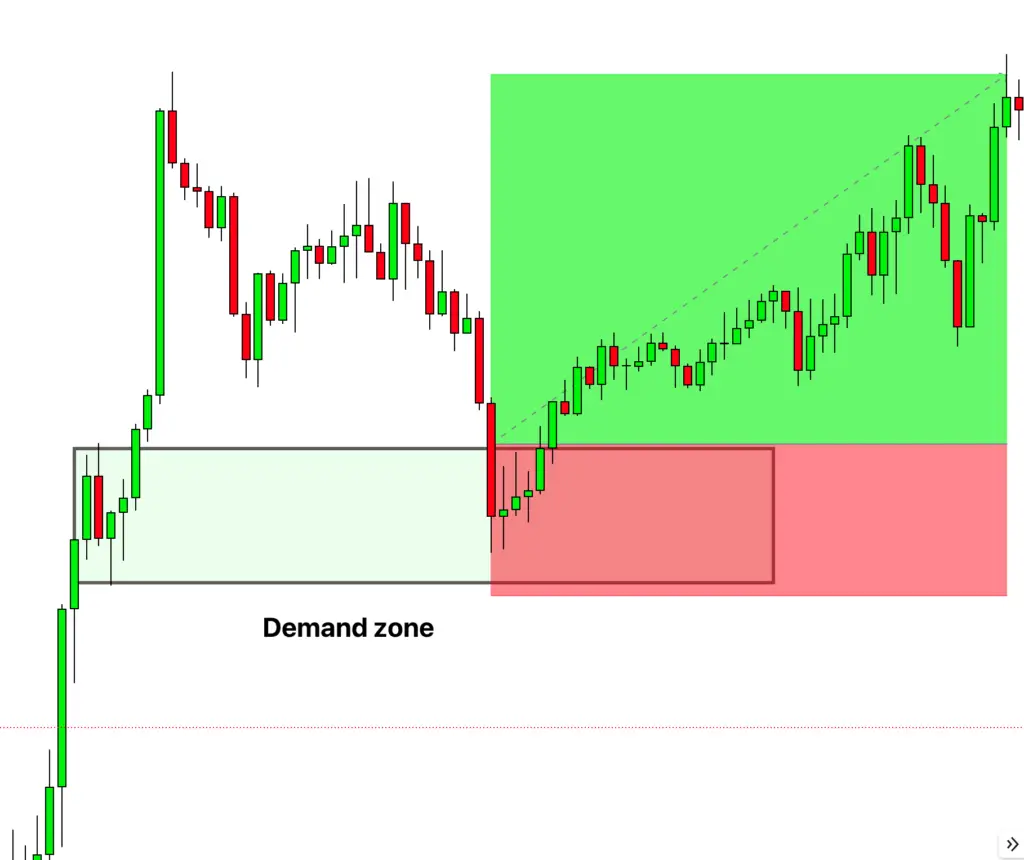
- Post-RBR formation, the market retraced to the highlighted demand zone. This is where ‘filling orders’ occurred – a phenomenon where accumulated buy orders at this level are executed.
- Market Reaction and Opportunity:
- The market responded to the demand zone with an upward movement, presenting a high reward opportunity for traders who capitalized on this rebound.

This pattern is a microcosm of market dynamics, where traders’ perceptions and decisions are based on the ongoing supply-demand relationship. Recognizing these patterns allows traders to anticipate potential price movements and make informed decisions.
This case study of the GBP/CAD pair in a 15-minute timeframe illustrates the practical application of the RBR pattern in Forex trading. By understanding the supply and demand dynamics and the psychology behind the RBR pattern, traders can identify high-probability trading opportunities with favorable risk-reward ratios.
Conclusion
The RBR pattern is significant for traders as it often suggests an area where prices are likely to find strong support, making it a potential entry point for a long position. The pattern is indicative of ongoing bullish sentiment in the market, with the base phase often viewed as a period of accumulation before the continuation of the trend.

