Welcome to InnerCircleTrader.net! If you’re interested in trading and want to learn about ICT SMT Divergence, you’re in the right place. As someone who’s been trading for years, I’d like to share this concept with you in simple terms. Whether you’re new to trading or have some experience, this guide will help you understand what ICT SMT Divergence is and how you can use it in your trading.
What Is ICT SMT Divergence?
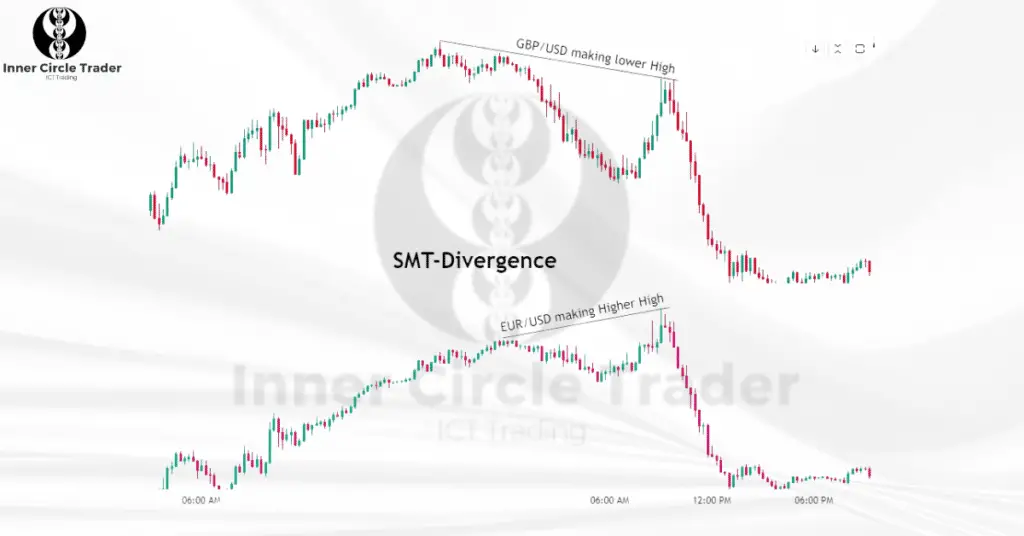
ICT SMT Divergence, also known as the Smart Money Technique divergence, occurs when two related assets that usually move together start moving differently on the same timeframe. In simpler words, it’s when two assets that should be going the same way aren’t doing so.
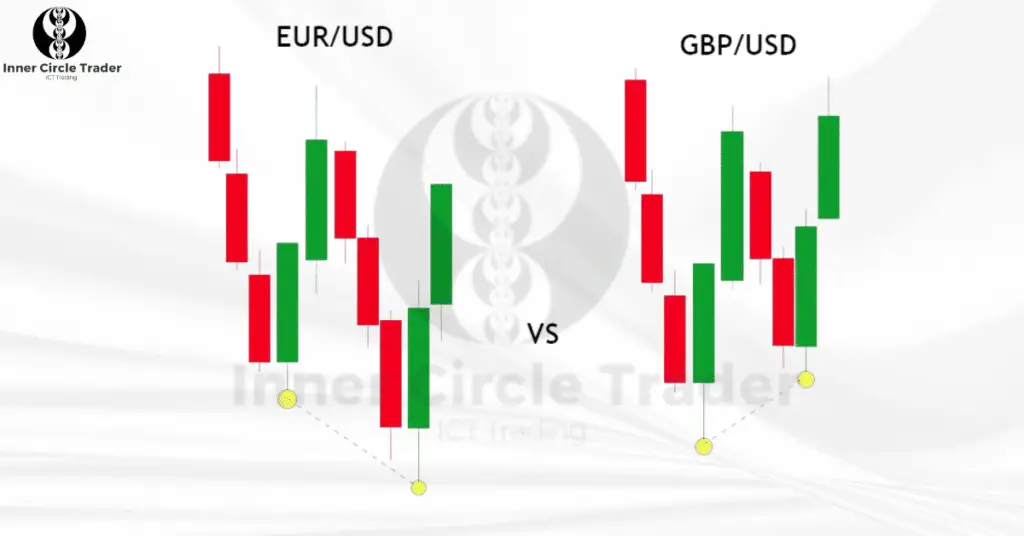
For example, consider two currency pairs like GBP/USD and EUR/USD. These pairs often move in the same direction because they’re positively correlated. If GBP/USD forms a higher low (suggesting a potential rise), but EUR/USD forms a lower low (suggesting a potential fall), we have a divergence. This difference can signal that a market reversal is coming.
Positive and Negative Correlation in Trading
Before we go further, it’s important to understand what correlation means in trading.
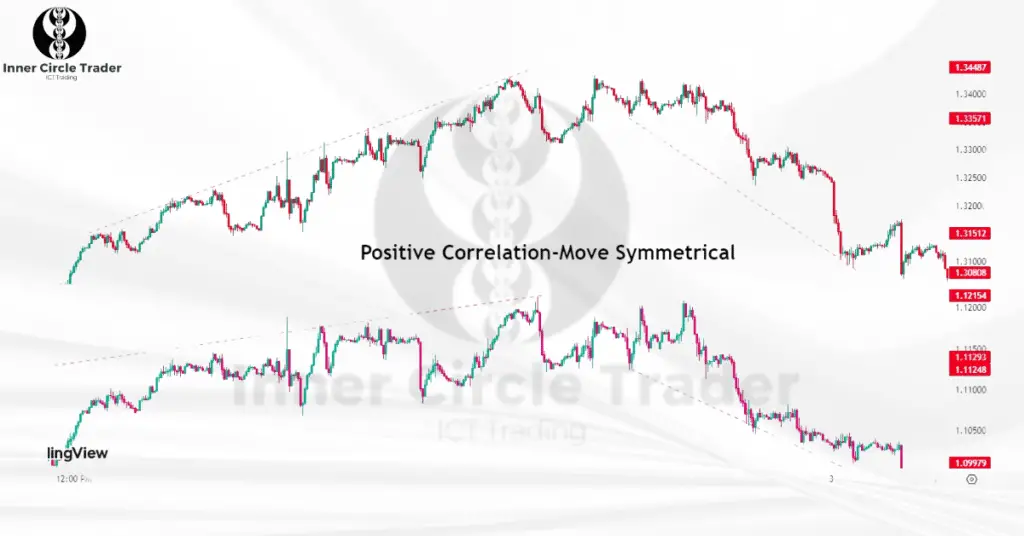
- Positive Correlation: This happens when two assets tend to move in the same direction. If one goes up, the other goes up too. In the forex market, pairs like GBP/USD and EUR/USD often move together. In the stock market, indices like the S&P 500 and Nasdaq 100 usually rise and fall together. In cryptocurrencies, Bitcoin and Ethereum often show this positive correlation.
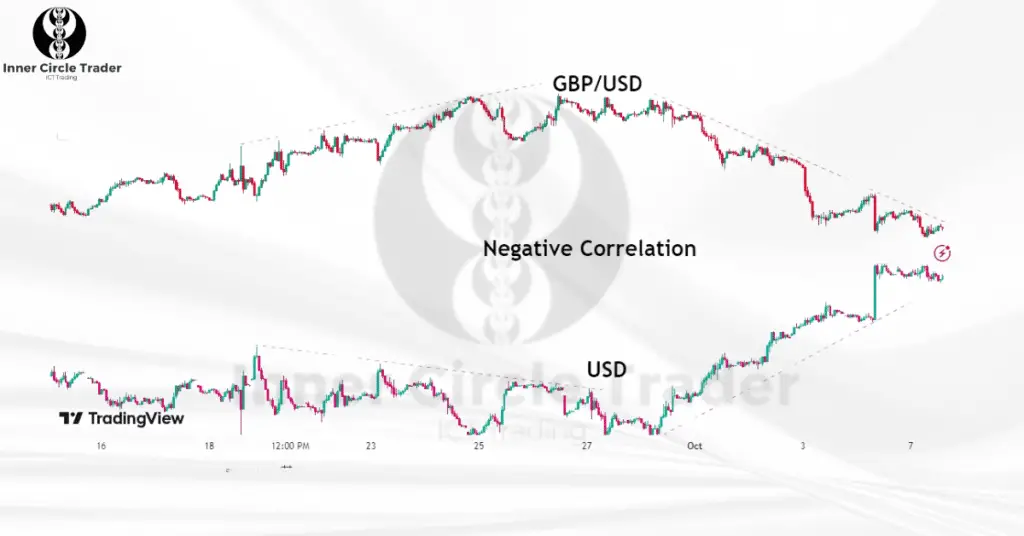
- Negative Correlation: This is when two assets move in opposite directions. If one goes up, the other goes down. A common example is the US Dollar Index (USDX) and the EUR/USD pair. When the USDX rises, EUR/USD tends to fall, and vice versa.
Types of ICT SMT Divergence
There are two main types of ICT SMT Divergence: Bullish and Bearish.
1. Bullish SMT Divergence
A Bullish SMT Divergence occurs when:
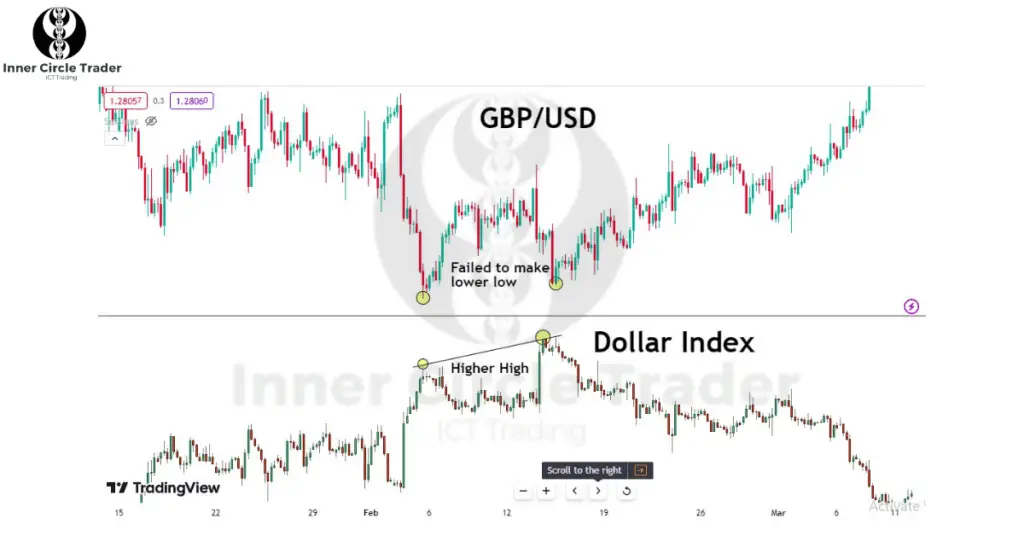
- In Positively Correlated Assets: Both assets are moving downwards. One asset makes a lower low, but the other makes a higher low. This suggests that the downward trend might be weakening, and an upward reversal could be coming.
- In Negatively Correlated Assets: One asset makes a lower high (still moving down), but the other makes a lower low instead of a higher low. This indicates that the asset making the lower low might be overextending, signaling a potential upward move.
Example: If GBP/USD and EUR/USD are both falling, but GBP/USD makes a higher low while EUR/USD makes a lower low, it could mean that the market is about to turn upwards.
2. Bearish SMT Divergence
A Bearish SMT Divergence happens when:
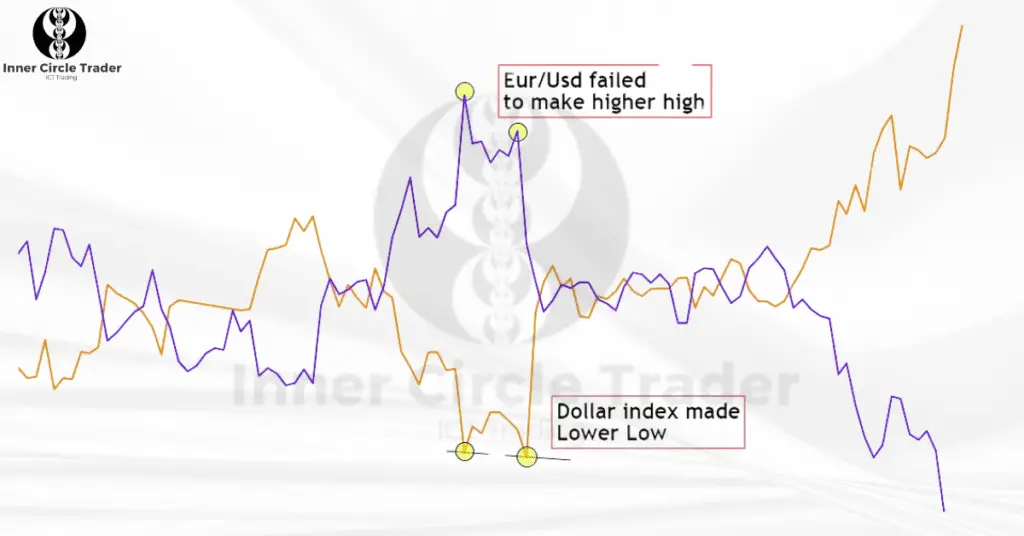
- In Positively Correlated Assets: Both assets are moving upwards. One asset makes a higher high, but the other makes a lower high. This suggests that the upward trend might be losing strength, and a downward reversal could occur.
- In Negatively Correlated Assets: One asset makes a higher low (still moving up), but the other makes a lower high instead of a higher high. This might mean that the asset making the lower high is showing weakness, pointing to a possible downward move.
Example: If GBP/USD and EUR/USD are both rising, but GBP/USD makes a lower high while EUR/USD makes a higher high, it could signal that the market is about to turn downwards.
How to Use ICT SMT Divergence in Trading
ICT SMT Divergence can help you spot key turning points in the market. Here’s how you can use it:
- Identify Reversal Points: When you notice a divergence between two correlated assets, it can indicate that the current trend is about to reverse. This can be a signal to prepare for a potential trade.
- Confirm Trade Entries: If you’re planning to enter a trade based on other analysis, an SMT divergence can provide additional confirmation. For example, if you’re considering a buy trade and see a bullish SMT divergence, it strengthens your decision.
- Use with Other Tools: It’s a good idea to combine SMT divergence with other trading tools, like support and resistance levels, trend lines, or moving averages. This can improve the reliability of your trade setups.
Best Timeframes to Spot ICT SMT Divergence
ICT SMT Divergence is best observed on lower timeframes, such as the 15-minute chart or lower. This is because divergences on higher timeframes take longer to form, and you might miss out on timely trading opportunities. Monitoring lower timeframes allows you to spot divergences as they happen, helping you make quicker trading decisions.
Best Asset Pairs for ICT SMT Divergence
Originally, ICT SMT Divergence was used for indices like the Nasdaq 100 (NQ) and the S&P 500 (ES), which are positively correlated. However, this concept works well across different markets:
- Forex Pairs: GBP/USD and EUR/USD are great examples of positively correlated pairs where SMT divergence can be applied.
- Metals: Gold (XAU/USD) and Silver (XAG/USD) often move together, making them suitable for spotting divergences.
- Cryptocurrencies: Bitcoin (BTC) and Ethereum (ETH) usually show positive correlation, providing opportunities to use SMT divergence.
- Dollar Index and Currency Pairs: The US Dollar Index (USDX) is negatively correlated with many currency pairs like EUR/USD, allowing for divergence analysis.
The stronger the correlation between the assets, the more reliable the SMT divergence signals will be. Always choose assets that have a well-known correlation for the best results.
Conclusion
ICT SMT Divergence is a useful technique that can help you identify potential market reversals by observing the price movements of correlated assets. By understanding this concept and incorporating it into your trading strategy, you can make more informed decisions and potentially improve your trading performance.
Frequently Asked Questions (FAQs)
ICT SMT Divergence stands for Smart Money Technique Divergence. It refers to a situation where two correlated assets start showing opposite movements on the same timeframe. This divergence can signal that the current market trend might be about to reverse.
You can use ICT SMT Divergence to identify potential reversal points in the market. By monitoring divergences between correlated assets, you can get early signals of trend changes. Combining SMT divergence with other trading tools like support and resistance levels can enhance your strategy.
Assets that have a strong positive or negative correlation are best for spotting SMT divergence. Examples include GBP/USD and EUR/USD in forex, Gold and Silver in metals, Bitcoin and Ethereum in cryptocurrencies, and indices like the S&P 500 and Nasdaq 100.
It’s best to look for ICT SMT Divergence on lower timeframes, such as the 15-minute chart or lower. This allows you to spot divergences more quickly and take advantage of timely trading opportunities.
While ICT SMT Divergence can provide valuable insights, it’s recommended to use it in combination with other trading tools and analysis methods. This can increase the reliability of your trading decisions and help you manage risk more effectively.
