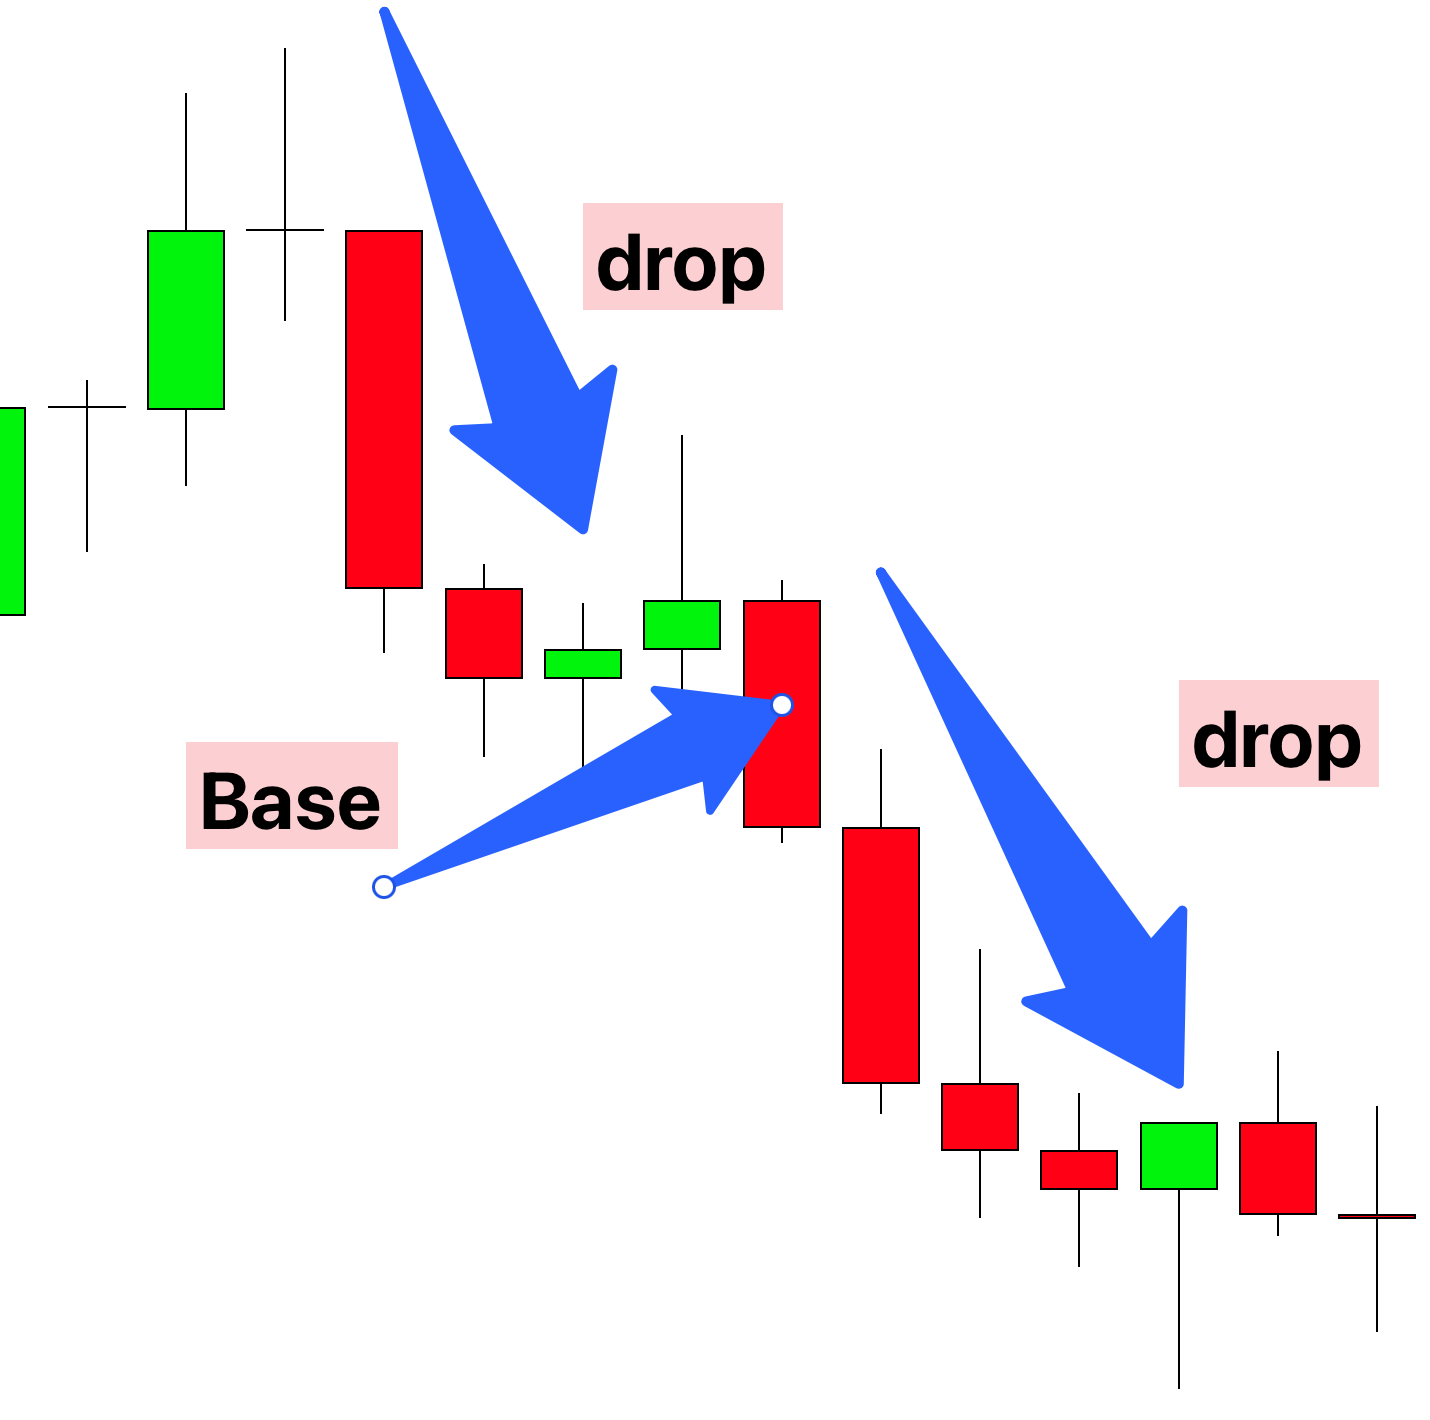
Drop Base Drop (DBD) is a price action pattern in trading that is commonly used to identify potential areas of strong supply in a market. Like RBR, it is a pattern frequently analyzed in technical analysis and consists of three distinct phases:
- Drop: The initial phase is characterized by a significant downward price movement, indicating strong selling pressure. This drop demonstrates that sellers are dominating the market, driving the price lower.
- Base: After the initial drop, the price enters a consolidation phase, moving sideways. This phase represents a relative equilibrium between buyers and sellers. The base signifies a period of pause in the price trend, suggesting that the market is assimilating and assessing the recent downward movement.
- Drop Again: The pattern concludes with another downward movement in price, echoing the first drop. This subsequent drop phase implies that selling pressure has persisted, and the initial downward trend is likely to continue.
Step-by-Step Guide to DBD Trading
- Spotting the Drop: Begin by looking for a strong price decrease. This initial drop is the first indication of a potential DBD pattern and suggests dominant selling pressure.
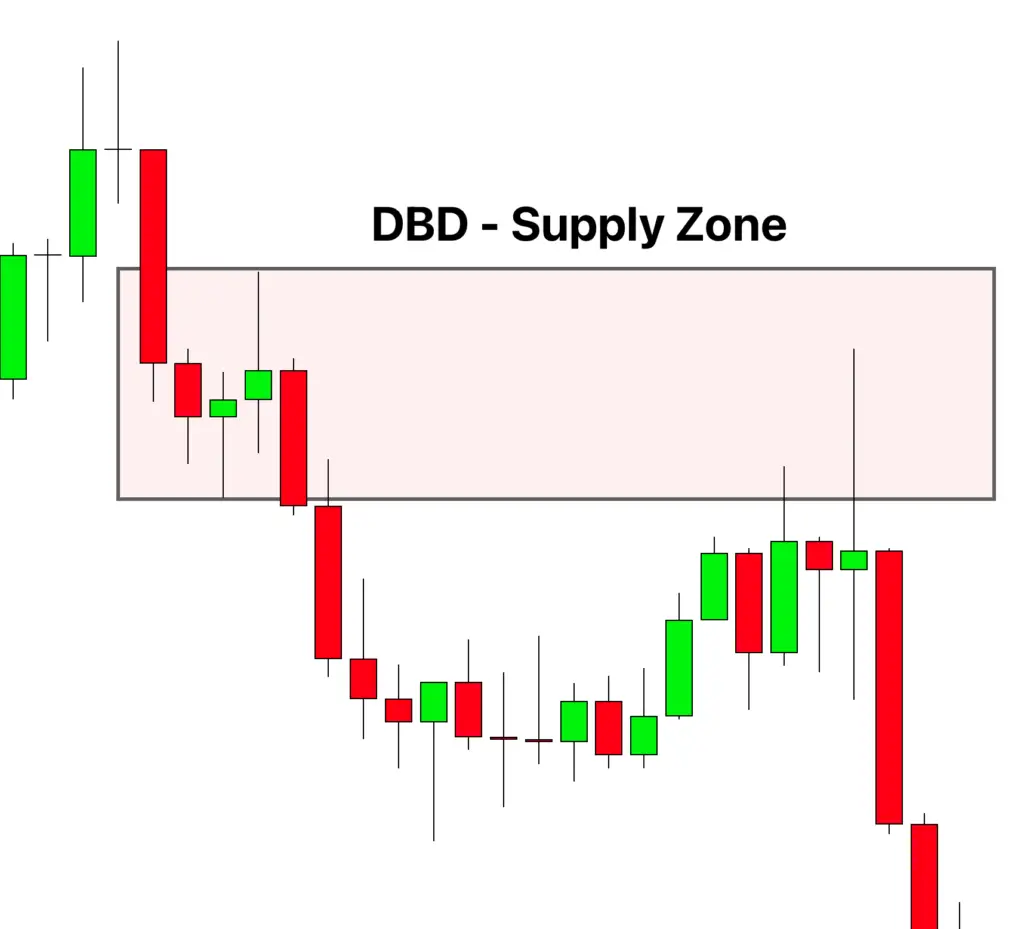
- Identifying the Base: After the drop, watch for a period where the price movement stabilizes and starts moving sideways. This consolidation phase indicates a temporary balance between buyers and sellers, where the market is taking a pause.
- Confirming the Second Drop: A subsequent price drop following the base is a key confirmation of the DBD pattern. This second drop signifies that selling pressure has resumed, making it a potential signal for a short position.
- Entry and Exit Points: Consider entering a trade at the beginning of the second drop. Your exit strategy should be clearly defined, using profit targets or stop-loss orders to effectively manage risk.
- Combining DBD with Other Tools: To enhance the effectiveness of your trading strategy, integrate the DBD pattern with other technical analysis tools. This approach helps in validating the pattern and refining both entry and exit points for your trades.
Understanding Supply and Demand in Trading
To comprehend the Drop Base Drop (DBD) pattern in trading, a fundamental grasp of supply and demand dynamics is crucial.
Supply and Demand Dynamics
- Supply: In the context of the DBD pattern, supply is the availability of the asset in the market. A high supply level, especially in the context of weakening demand, can lead to the formation of the initial drop in the DBD pattern.
- Demand: Demand is the level of buyers’ interest in purchasing an asset. In the DBD scenario, weakening demand, especially when coupled with increased supply, plays a pivotal role in driving the price downwards.
The Interaction in DBD
The DBD pattern is a reflection of the supply and demand dynamics at play:
- Initial Drop: This phase occurs when supply exceeds demand, leading to an excess of the asset in the market. As a result, the price starts to fall, marking the beginning of the DBD pattern.
- Base Formation: Following the drop, the market enters a consolidation phase where supply and demand reach a temporary equilibrium. This phase is characterized by sideways movement of the price, indicating a pause or a re-evaluation of the asset’s value by the market.
- Second Drop: A subsequent decrease in price after the base indicates a continued excess of supply over demand. This reinforces the bearish trend and completes the DBD pattern.
Price Movements in DBD
- Price Decrease: In the DBD pattern, an initial excess of supply (or a decrease in demand) leads to a drop in price. This is followed by a period of market indecision (base) and a further decline in price as supply continues to outstrip demand.
Psychology Behind the DBD Pattern
Understanding the psychological factors at play in the Drop Base Drop (DBD) pattern is essential for effectively utilizing it in trading strategies.
- First Drop Phase:
- This phase is marked by a significant downward price movement, reflecting strong market interest in selling or a lack of demand. This initial drop is often triggered by a surge of traders acting on negative news, market shifts, or perceived overvaluation of the asset.
- The psychology here is one of urgency among sellers, driven by expectations of further decline, leading to a rush to offload the asset.
- Base Phase:
- The base, or consolidation phase, occurs when the price movement stabilizes, indicating a period of indecision in the market.
- During this phase, the sentiment is mixed as traders assess whether the price will continue to drop or if it has reached its low point. This equilibrium reflects a psychological standoff between buyers and sellers, each gauging the asset’s value and future direction.
- Second Drop Phase:
- The subsequent price drop is a significant psychological moment, indicating a market consensus leaning towards continued bearish sentiment.
- This phase reveals that the market participants, after the period of consolidation, collectively agree on the asset’s reduced value, leading to a renewed selling interest and further driving down the price.
Case Study: GBP/CAD 15-Minute Timeframe – Drop Base Drop (DBD) Structure
This case study examines a Drop Base Drop (DBD) structure in the GBP/CAD currency pair within a 15-minute timeframe. The focus is on understanding the market psychology and supply and demand dynamics that influence the DBD pattern.
In the context of the DBD pattern, supply and demand continue to be the fundamental forces driving price movements. An increase in supply or a decrease in demand typically results in a price fall, and the reverse leads to a price rise. This relationship is critical for comprehending the DBD pattern.
The Market Scenario
- Initial Impulsive Wave:
- The analysis begins with a significant downward movement in the GBP/CAD pair. This impulsive wave sets the stage for the DBD pattern.
- DBD Structure Formation:
- Within this downward trend, a DBD structure emerged, starting with a rapid price decrease (first drop), followed by a stabilization period (base), and culminating in another price decrease (second drop).
- A supply zone was discerned at the base phase, indicating a strong selling interest.
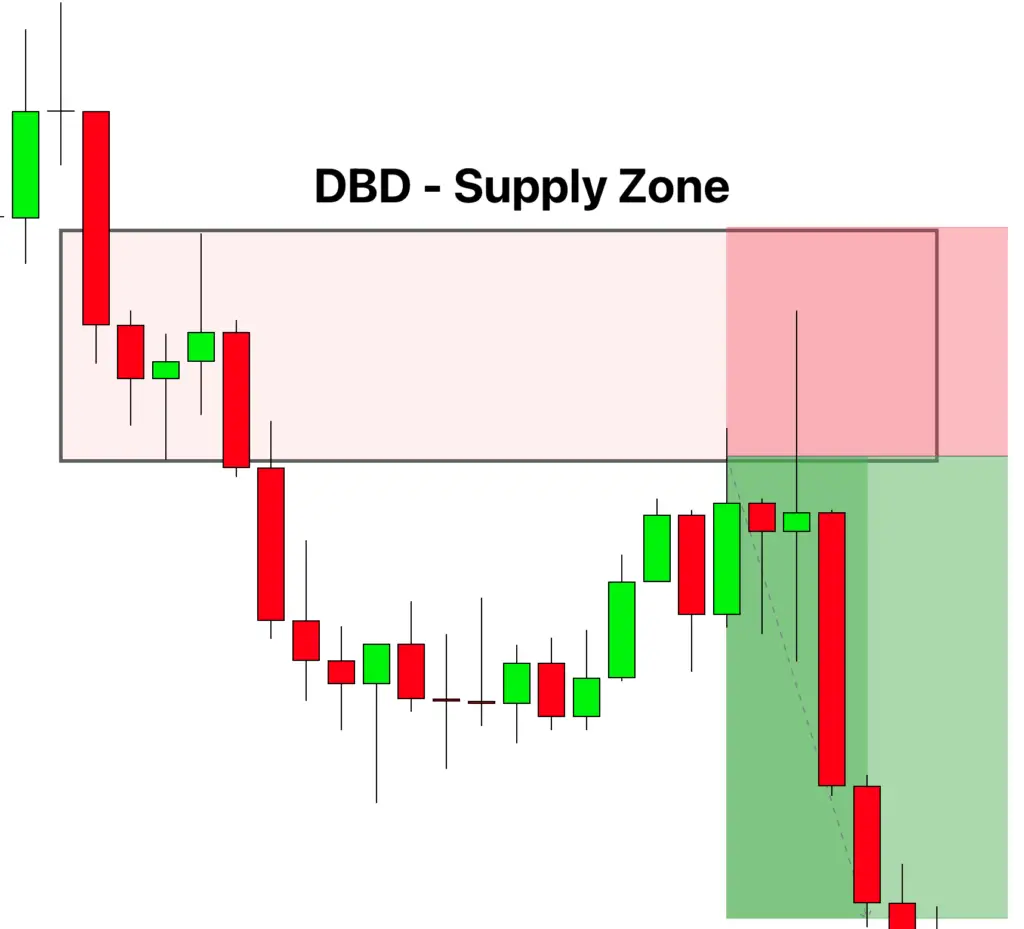
- Market Reversal to the Supply Zone:
- After forming the DBD structure, the market retraced to the established supply zone. This retracement is where the ‘execution of sell orders’ likely happened – a situation where accumulated sell orders at this level are fulfilled.
- Market Reaction and Opportunity:
- The market’s reaction to the supply zone was a further downward movement, offering a high reward potential for traders who took advantage of this trend continuation.
The GBP/CAD case study in the 15-minute timeframe illustrates how the DBD pattern, driven by supply and demand dynamics, can signal potential selling opportunities. Understanding these patterns and the psychology behind them enables traders to make more informed decisions, identifying key zones for potential entry or exit points in a bearish market environment.
Conclusion
The Drop Base Drop (DBD) pattern holds significant value for traders, as it typically indicates an area where prices may encounter strong resistance, presenting a potential entry point for a short position. The DBD pattern is reflective of prevailing bearish sentiment in the market. The base phase in this pattern is frequently seen as a period of distribution, where sellers gain strength before the continuation of the downward trend.