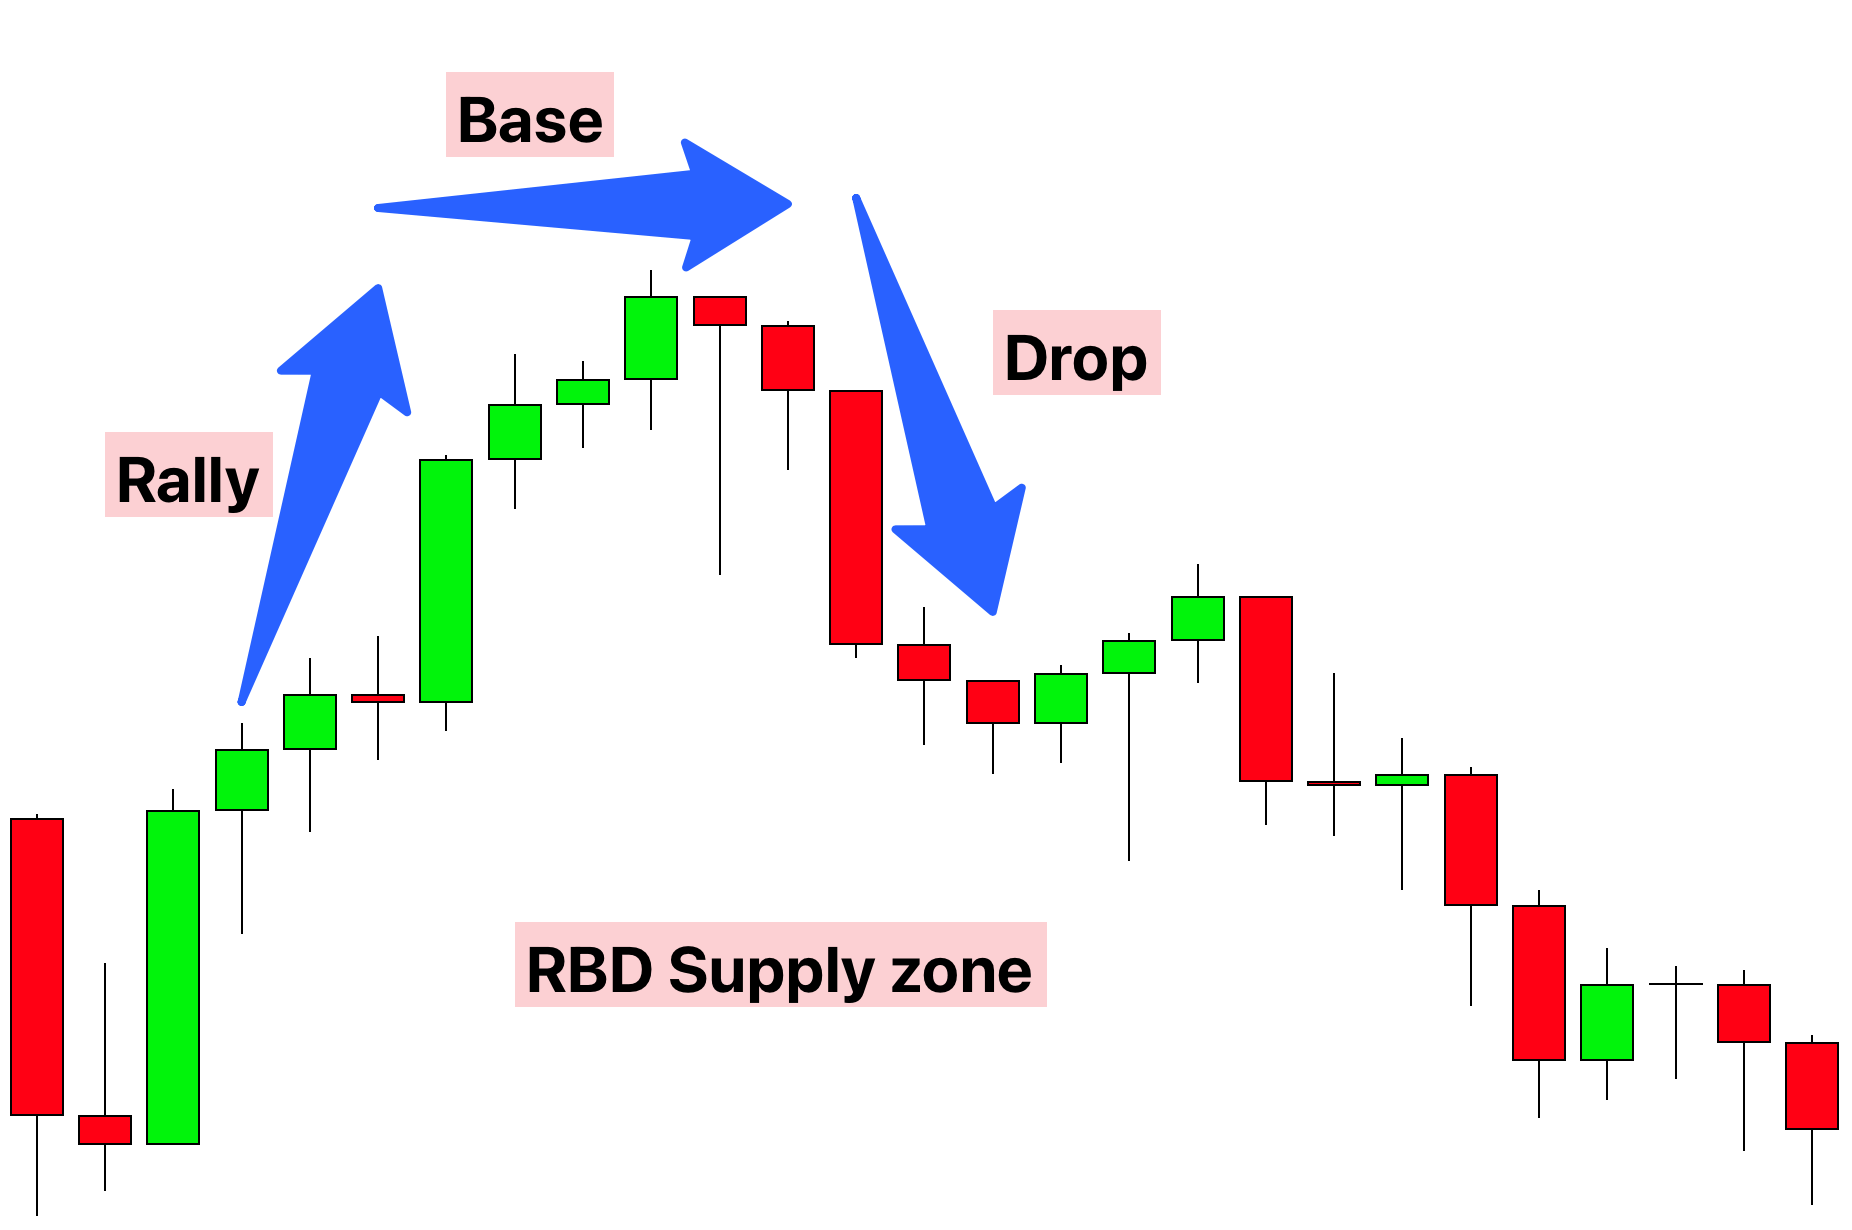
Rally Base Drop (RBD) is a price action pattern in trading, used to identify potential turning points where the market might shift from a bullish to a bearish trend. Similar to DBD, RBD is frequently analyzed in technical analysis and unfolds in three key phases:
- Rally: The first phase is marked by a significant upward price movement, indicating strong buying pressure. This rally signifies that buyers are in control, pushing the market higher. It reflects a bullish sentiment and a dominance of demand over supply.
- Base: Following the rally, the market enters a consolidation phase, where the price movement stabilizes and moves sideways. This phase suggests a relative balance between buyers and sellers. The base phase is a crucial period where the market pauses and reassesses the prevailing trend, potentially signaling a shift in market dynamics.
- Drop: The pattern concludes with a downward price movement, reversing the initial rally. This drop indicates a shift in market sentiment, where selling pressure starts to overcome the buying momentum. The occurrence of this drop suggests that the initial bullish trend may be losing steam, and a bearish trend could be commencing.
In essence, the RBD pattern serves as an indicator for traders to identify potential reversal points from a bullish to a bearish market.
Step-by-Step Guide to RBD Trading
- Spotting the Rally: Start by identifying a strong price increase. This initial rally is your first sign of a potential RBD pattern, indicating dominant buying pressure.
- Identifying the Base: After the rally, observe a period where the price stabilizes and begins to move sideways. This consolidation phase signals a temporary equilibrium between buyers and sellers, representing a pause in the market’s momentum.
- Confirming the Drop: A crucial aspect of the RBD pattern is the subsequent price drop following the base. This decline is a critical confirmation of the RBD pattern. It suggests that the buying pressure has weakened, and selling pressure is starting to take over, indicating a potential signal for a short position.
- Entry and Exit Points: Consider entering a trade at the start of the drop following the base. As with any trading strategy, it’s vital to have a clear exit plan. Set your exit strategy with defined profit targets or stop-loss orders to manage risks effectively.
- Combining RBD with Other Tools: For a more robust trading strategy, combine the RBD pattern analysis with other technical analysis tools. This multidimensional approach can provide a more comprehensive market analysis, helping to confirm the RBD pattern and refine your trading decisions regarding entry and exit points.
By following these steps, traders can systematically approach the RBD pattern, which is particularly useful in scenarios where the market shows signs of transitioning from a bullish to a bearish trend.
Understanding Supply and Demand in Trading: Rally Base Drop (RBD) Pattern
To effectively understand the Rally Base Drop (RBD) pattern in trading, it’s essential to comprehend the underlying dynamics of supply and demand.
Supply and Demand Dynamics
- Supply: In the RBD context, supply represents the availability of the asset in the market. Initially, a lower supply level relative to demand can lead to the formation of the initial rally in the RBD pattern.
- Demand: Demand is the level of buyers’ interest in purchasing an asset. In the RBD scenario, increasing demand, especially when coupled with reduced supply, plays a crucial role in driving the price upwards initially.
The Interaction
The RBD pattern reflects the interplay of supply and demand dynamics:
- Initial Rally: This phase occurs when demand exceeds supply, leading to a shortage of the asset in the market. As a result, the price starts to rise, marking the beginning of the RBD pattern.
- Base Formation: After the rally, the market enters a consolidation phase where supply and demand reach a temporary equilibrium. This phase is characterized by sideways movement of the price, indicating a pause or a reassessment of the asset’s value by the market.
- Drop: A subsequent decrease in price following the base indicates a shift, where supply begins to surpass demand. This shift marks the beginning of a bearish trend and completes the RBD pattern.
Price Movements
- Price Dynamics: In the RBD pattern, an initial imbalance in favor of demand (or a reduction in supply) leads to an increase in price. This is followed by a period of market equilibrium (base) and then a decline in price as supply starts to overwhelm demand.
Understanding these dynamics is crucial for traders looking to capitalize on the RBD pattern.
Psychology Behind the Rally Base Drop (RBD) Pattern
Understanding the psychological factors at play in the Rally Base Drop (RBD) pattern is crucial for its effective application in trading strategies.
- First Rally Phase:
- This phase is characterized by a significant upward price movement, reflecting a strong market interest in buying or a surge in demand. This initial rally is often driven by positive market news, shifts in economic indicators, or perceived undervaluation of the asset.
- The psychology here is one of optimism among buyers, fueled by expectations of continued price increase, leading to an eagerness to acquire the asset.
- Base Phase:
- The base, or consolidation phase, occurs when the price movement stabilizes, indicating a period of indecision in the market.
- During this phase, the sentiment is mixed as traders assess whether the price will continue to rise or if it has reached its peak. This equilibrium reflects a psychological standoff between buyers and sellers, each evaluating the asset’s value and potential future direction.
- Drop Phase:
- The subsequent price drop represents a crucial psychological shift, indicating a market consensus leaning towards bearish sentiment.
- This phase reveals that the market participants, after a period of consolidation, collectively reassess the asset’s value, leading to a shift in interest from buying to selling. This change in sentiment results in a renewed selling interest, driving the price down.
Case Study: GBP/CAD 15-Minute Timeframe – Rally Base Drop (RBD) Structure
This case study focuses on a Rally Base Drop (RBD) structure in the GBP/CAD currency pair within a 15-minute timeframe. The aim is to comprehend the market psychology and supply and demand dynamics that shape the RBD pattern.
Understanding Supply and Demand in the RBD Context
In the RBD pattern, the interplay of supply and demand is pivotal in driving price movements. An increase in demand or a decrease in supply usually leads to a price rise, with the reverse causing a price fall. This dynamic is fundamental in understanding the RBD pattern.
The Market Scenario
- Initial Impulsive Wave:
- The case study begins with a notable upward movement in the GBP/CAD pair. This impulsive wave forms the basis for the RBD pattern.
- RBD Structure Formation:
- During this upward trend, an RBD structure developed, characterized by a rapid price increase (first rally), followed by a period of stabilization (base), and culminating in a price decrease (drop).
- A demand zone was identified at the base phase, indicating strong buying interest initially.
- Market Reversal to the Demand Zone:
- Post-RBD formation, the market reversed back to the demand zone. This point likely marked the ‘execution of buy orders’ – where previously accumulated buy orders at this level were activated.
- Market Reaction and Opportunity:
- The market’s response to the demand zone was a downward movement, presenting a high reward potential for traders who capitalized on this reversal.
This GBP/CAD case study in the 15-minute timeframe demonstrates how the RBD pattern, influenced by supply and demand dynamics, can indicate potential reversal points for selling opportunities. By understanding these patterns and the underlying psychology, traders can make more informed decisions. Identifying these key zones helps in planning entry or exit points in a market that’s transitioning from bullish to bearish.
Conclusion
The Rally Base Drop (RBD) pattern is of considerable importance to traders, as it often signals a potential reversal from a bullish to a bearish market trend. This pattern usually indicates an area where prices might find strong support before turning downwards, offering a potential entry point for a short position.
The RBD pattern is indicative of a shift in market sentiment – from bullish to bearish. In this pattern, the base phase is often perceived as a period of accumulation, where buyers initially show strength before the trend reverses and sellers take over, leading to a continuation of the downward trend.