Introduction
The idea of making a 10% return every month in trading might sound ambitious, but it’s definitely within reach for many traders. In this guide, we’ll look at how to aim for this kind of return, focusing on practical and smart trading strategies.
We’re using the Aussie dollar as our case study. It’s a popular choice among traders because of its unique market behavior and the clear opportunities it presents. By examining this specific currency pair, we’ll uncover valuable lessons and tactics that can apply to other trades as well.
The key here is understanding that making 10% a month isn’t about big, risky bets. Instead, it’s about being consistent, managing risks wisely, and knowing when to make your move. Whether you’re a seasoned trader or just starting out, these insights will be invaluable in helping you reach that 10% monthly goal.
Identifying Key Levels and Trade Setups
In trading, especially when aiming for consistent returns like 10% per month, identifying key levels on your charts is crucial. Here’s a simple breakdown of how to do this effectively:
Daily and Hourly Charts
- Start with the daily chart to spot major levels where the price has shown significant reactions in the past. These could be highs, lows, or areas where the trend has changed.
- Shift to the hourly chart to get a more detailed view. Here, you’re looking for finer points within those broad levels identified on the daily chart.
Understanding Liquidity Pools
- Liquidity pools refer to areas where there are likely to be a lot of orders placed – these can be buy or sell orders.
- These pools often form around key levels and are important because they can drive significant price movements.
- When the price reaches these liquidity pools, it can either break through them or reverse direction, so they’re crucial for planning entry and exit points.
For instance, if you identify a key resistance level on the Aussie dollar daily chart and notice a buildup of sell orders (a liquidity pool) near this level on the hourly chart, it could signal a good short-selling opportunity.
Risk Management and Trade Execution
When aiming for consistent returns in trading, such as a 10% monthly gain, managing your risk and executing your trades effectively are key. Here’s how to do it:
1. Reducing Risk Across Time Frames
Short-Term (e.g., 15-minute, 1-hour charts): On these time frames, market movements can be quick and volatile. Manage risk by using tighter stop-losses and being ready to exit a trade if it doesn’t move in your expected direction quickly.
Long-Term (e.g., daily charts): Here, the market has more room to move. You can afford wider stop-losses and give trades more time to develop. But, be cautious about holding positions for too long and exposing yourself to unexpected market shifts.
2. The Importance of Stop-Loss Orders
A stop-loss order is a must in trading. It automatically closes out your trade at a certain loss level, preventing a small loss from turning into a big one.
Always set your stop-loss based on the market’s behavior and your own risk tolerance, not just an arbitrary number.
3. Using Risk-Reward Ratios Wisely
The risk-reward ratio helps you decide whether a trade is worth taking. A common approach is to look for opportunities where the potential reward is at least three times greater than the risk.
For example, if you risk $100 on a trade, look for setups where you could make at least $300. This way, even if not all trades are winners, the successful ones cover the losses and still yield a profit.
Trade Example Analysis
Let’s analyze a specific trade setup on the Aussie dollar (AUD) and see how using different time frames can help in reducing risk:
1. The Setup:
Daily Chart: Imagine we spot a significant level at 0.7512 on the AUD daily chart, where the price has bounced several times, indicating strong support.
Hourly Chart: Zooming into the hourly chart, we notice buy stops accumulating above this level, suggesting that if the price breaks above 0.7512, it could trigger a sharp upward move.
2. Framing the Trade:
Entry Point: Based on the hourly chart, you might decide to enter a long position if the price breaks above 0.7512, anticipating the activation of buy stops.
Stop-Loss: Set a stop-loss just below the support level, say at 0.7500, to limit potential losses if the market doesn’t move as expected.
Profit Target: Looking at the potential for the price to rise, you might set a profit target around 0.7612, which is 100 pips above your entry point.
3. Reducing Risk with Multiple Time Frames:
15-Minute Chart: Further refine your entry by looking at a shorter time frame, like the 15-minute chart, for more precise signals such as a bullish candlestick pattern right above 0.7512.
5-Minute Chart: You could also use a 5-minute chart to fine-tune your stop-loss placement. For instance, if there’s a bullish order block close to your entry point, you might set your stop-loss just below it, reducing the risk further.
4. Trade Management:
First Profit Target: Once the trade is in profit, say reaching a 3:1 reward-to-risk ratio, consider taking off part of your position to lock in gains.
Letting It Run: Leave the remaining portion of the trade to aim for the higher targets identified on the hourly chart, like the 0.7612 level.
In this trade example, by using multiple time frames, you can enter the trade with a clear plan, manage your risk effectively, and capitalize on the potential upside while minimizing potential losses.
The Power of Compound Growth
When it comes to trading, consistently making a 10% return per month can have a profound impact on your trading account due to the power of compounding. Compounding is the process where the value of an investment increases because the earnings on an investment, both capital gains and interest, earn interest as time passes. This concept is key in understanding how regular, consistent gains, even small ones, can lead to significant growth over time.
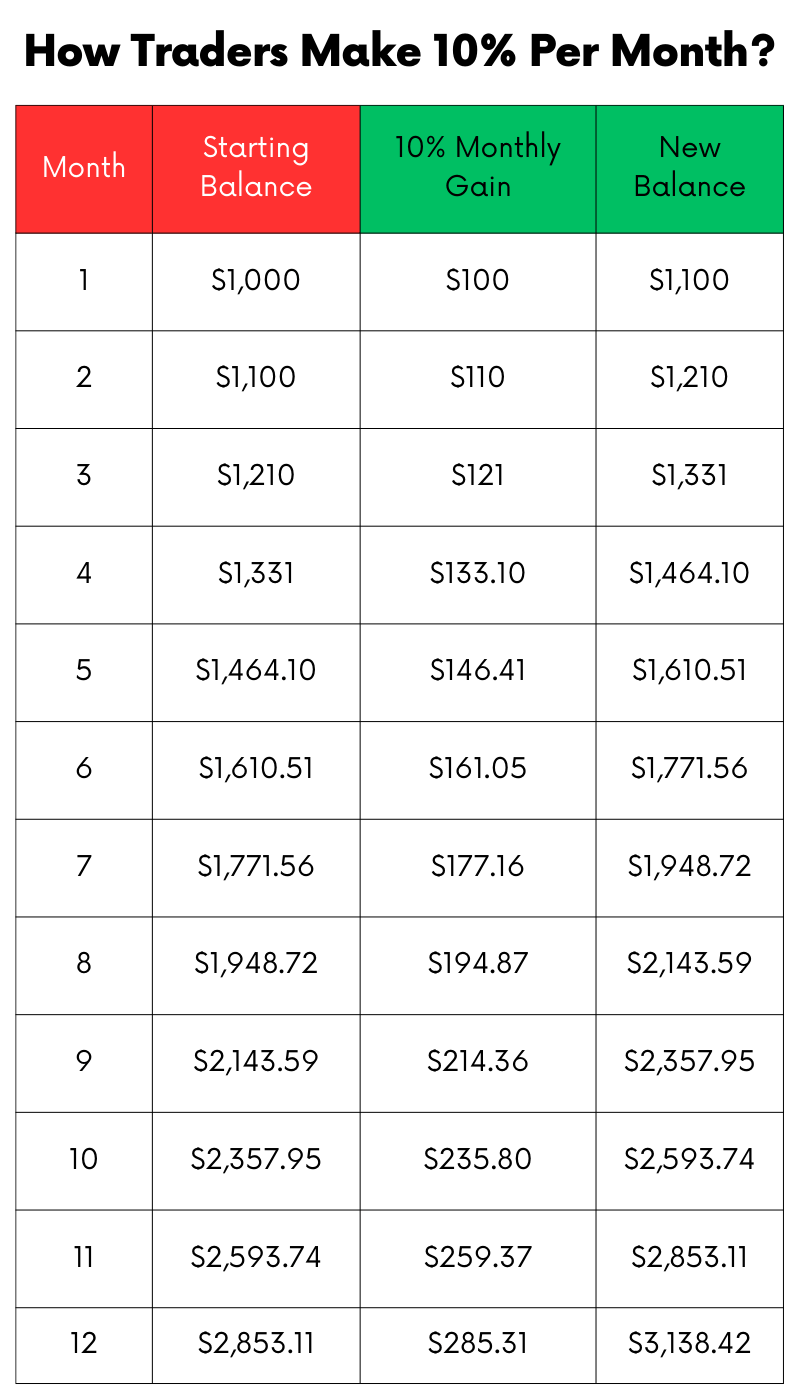
Let’s say you start with a trading balance of $1,000. Aiming for a 10% return per month might seem modest at first, but the cumulative effect over time is substantial. Here’s a simple example to illustrate this point:
| Month | Starting Balance | 10% Monthly Gain | New Balance |
|---|---|---|---|
| 1 | $1,000 | $100 | $1,100 |
| 2 | $1,100 | $110 | $1,210 |
| 3 | $1,210 | $121 | $1,331 |
| 4 | $1,331 | $133.10 | $1,464.10 |
| 5 | $1,464.10 | $146.41 | $1,610.51 |
| 6 | $1,610.51 | $161.05 | $1,771.56 |
| 7 | $1,771.56 | $177.16 | $1,948.72 |
| 8 | $1,948.72 | $194.87 | $2,143.59 |
| 9 | $2,143.59 | $214.36 | $2,357.95 |
| 10 | $2,357.95 | $235.80 | $2,593.74 |
| 11 | $2,593.74 | $259.37 | $2,853.11 |
| 12 | $2,853.11 | $285.31 | $3,138.42 |
In this table, you can see how a $1,000 account grows over a year with a consistent 10% monthly return. By the end of the year, the account more than triples in size.
Profit Taking and Trade Management
Effectively managing a trade and knowing when to take profits are crucial skills for any trader, especially when aiming for a consistent return like 10% per month. Here are some strategies to help with this:
1. Setting Profit Targets:
- Determine realistic profit targets based on your analysis. Use key levels identified on your charts as potential targets.
- For instance, if you enter a trade on the Aussie dollar at 0.7512 with an upward potential, you might set your first profit target near a recent high or resistance level.
2. Partial Profit Taking:
- Consider taking partial profits at your first target. This strategy secures a portion of your gains and reduces the risk on the remaining position.
- For example, you might sell half of your position once the first target is reached, ensuring you lock in some profits.
3. Trailing Stop-Losses:
- To let the rest of your trade run for potentially higher gains, use a trailing stop-loss. This tool locks in profits while giving the trade room to grow.
- As the price moves favorably, move your stop-loss up (for a long position) or down (for a short position) to secure more profits.
4. Balancing Risks and Rewards:
- It’s essential to find a balance between securing profits early and allowing your trade the chance to reach its full potential.
- Regularly reassess the market conditions. If the market still looks favorable, you might let your trade run longer; if not, it might be wise to take more profits off the table.
5. Managing Remaining Positions:
- For the remaining part of your trade, continue to monitor market conditions and adjust your strategy accordingly.
- Be ready to exit the trade if the market shows signs of reversing or if your analysis indicates that the potential for further gains is limited.
Leveraging High Time Frame Objectives
When aiming for a consistent return like 10% per month, using high time frame objectives can significantly enhance your trading decisions. Here’s how to do it:
Using High Time Frame Objectives:
Analyze longer time frames (like daily or weekly charts) to identify major trends and levels. These provide a roadmap for where the market could head in the longer term.
For example, if the weekly chart of the Aussie dollar shows a strong uptrend, use this information to look for buy opportunities on shorter time frames.
Aligning Trades with Institutional Activity:
Institutional traders often operate on higher time frames, and their actions can significantly influence market directions.
Identify areas where institutions might be entering or exiting the market. These could be levels with significant historical price reactions or areas of high liquidity.
Aligning your trades with these institutional activities can increase the likelihood of your trades being on the right side of significant market moves.
Conclusion
To sum up, making 10% per month in trading is about strategic planning and execution. By identifying key levels on daily and hourly charts, understanding the impact of liquidity pools, managing risks effectively, and taking profits smartly, you set a solid foundation for your trading. Leveraging high time frame objectives and aligning your trades with institutional activities further strengthens your approach.