Introduction
Welcome to our guide on time frames and trade setups. This is part of our third-month learning in the ICT mentorship.
When you trade, choosing a time frame is very important. It helps you decide how to look at the market. Whether you’re looking at long-term trends or quick changes, your time frame can really change how you understand the market.
It’s also key to know your trade setups. This means knowing when to start and end your trades. It’s not just about following what the market does, but about matching the market to your own style.
This month, we’re going to focus on these areas. We want to help you pick time frames that fit how you trade and make setups that work for you. Getting this right is a big part of doing well in trading.
Time Frame Selection in Trading
Monthly Chart Analysis
- Role in Position Trading: The monthly chart is crucial for position trading. This is where you look at the market over a longer period, like several months or years. It helps you see big trends and make decisions for longer-term trades.
- Utility for Traders Intolerant to Intraday Trading: If quick, daily market changes are not your thing, the monthly chart is your ally. It lets you trade without getting caught up in the day-to-day noise of the market.
- Insights on Long-term Market Direction: Monthly charts give you a clear picture of where the market is heading in the long run. They show big patterns and trends that can help you guess what might happen in the future.
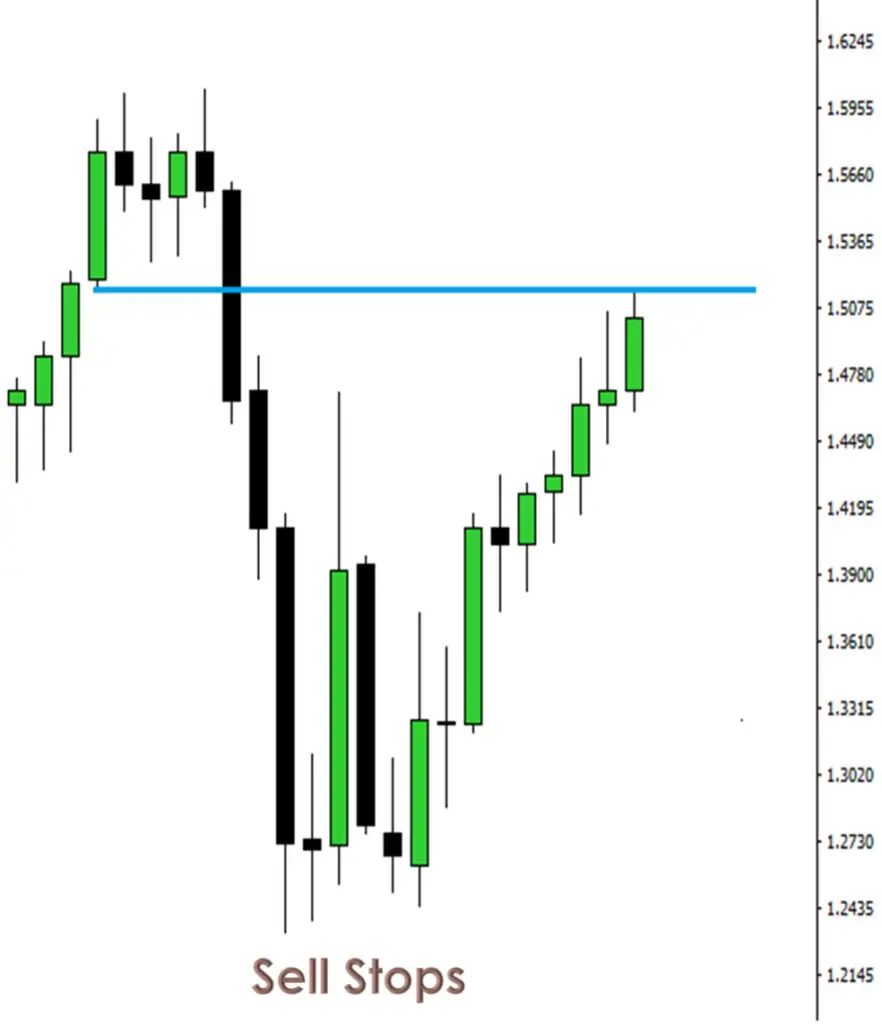
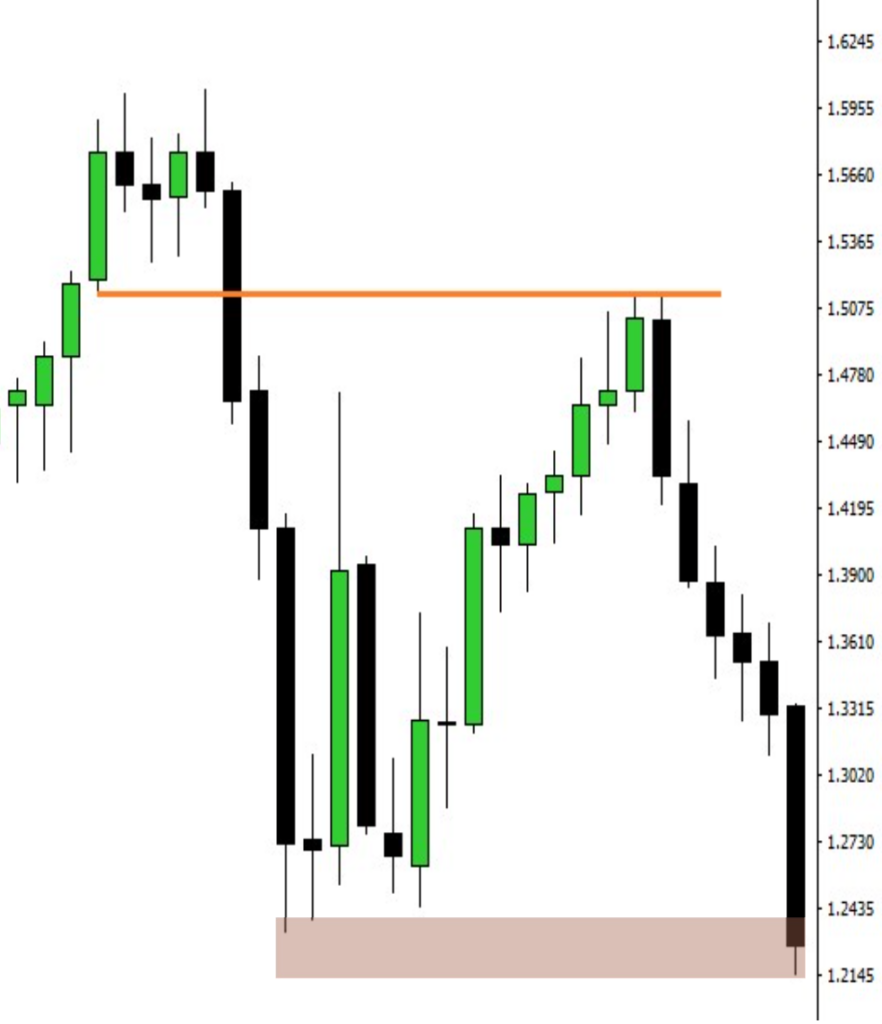
Weekly Chart Analysis
- Application in Swing Trading: The weekly chart is perfect for swing trading. This means looking at the market week by week. It’s good for those who want to trade more often than position traders but don’t want the rush of daily trading.
- Balance between Patience and Trading Frequency: Using the weekly chart is about finding a middle ground. You need some patience, but you don’t have to wait as long as you would with monthly charts. It’s good for traders who like a steady pace.
- Utilization for Market Analysis and Short-term Trading Decisions: Weekly charts help you make sense of the market for short-term trades. They show you trends and levels that are important for the next few weeks or months. This can guide your trading decisions in the short term.
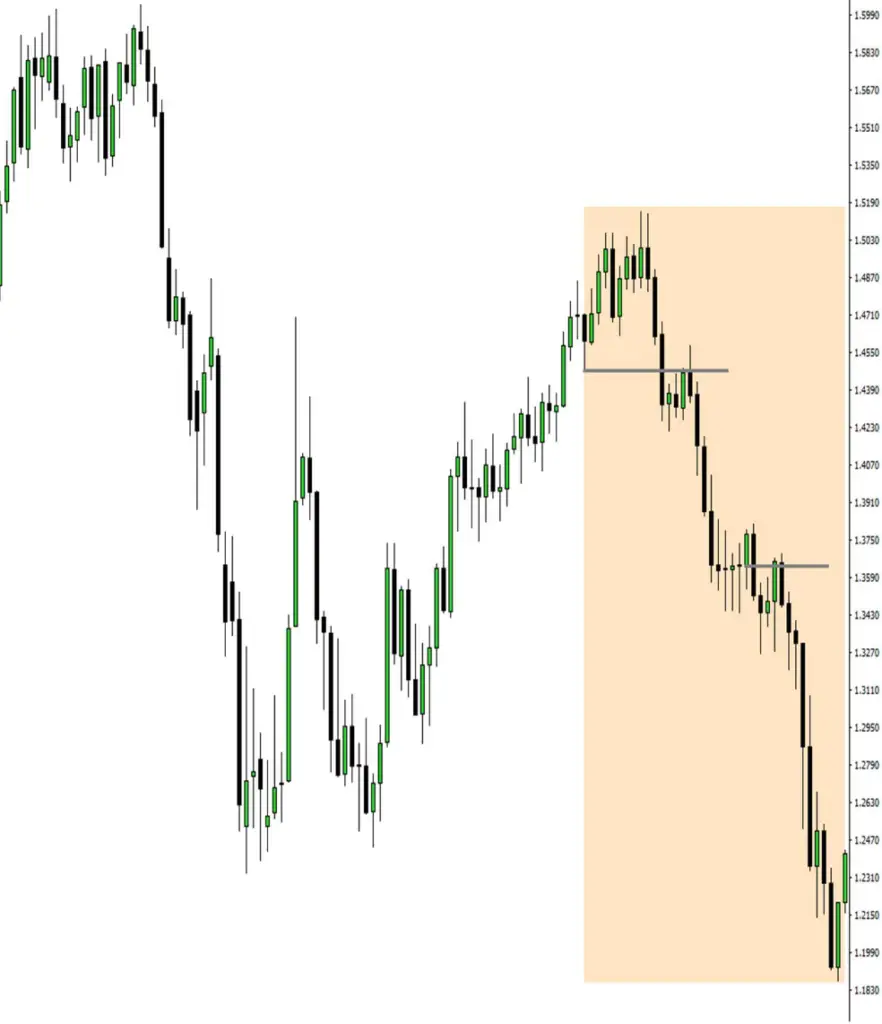
Each time frame in trading serves a different purpose and suits different trading styles.
Defining Trading Setups
Identifying Personal Trading Style and Setups
- Knowing your own trading style is key. It’s about how you like to trade, when you decide to buy or sell, and how long you hold your trades. Each trader is different, so it’s important to have setups that match your personal style.
Avoiding a One-Size-Fits-All Approach
- It’s not good to just follow one set way of trading. What works for one trader might not work for another. It’s better to have your own unique way of trading that feels right for you.
Exploring Different Trader Types
- Trend Traders: These traders look for long trends in the market. They usually hold their trades for a longer time, riding the trend.
- Swing Traders: Swing traders hold their trades for a few days or weeks. They try to catch the ‘swings’ in the market.
- Contrarian Traders: These traders go against the market trend. They look for times when the market might turn around and trade the opposite way.
- Short-term and Day Traders: These traders make quick trades. They buy and sell on the same day or hold for just a short time.
Matching Trading Setups with Your Life
- Your trading setups should fit with your life. This means thinking about how much time you can spend on trading, how you handle risk, and what your goals are. Your trading should feel comfortable and suit your daily life.
Utilizing High Time Frame Charts for Setup Identification
Analyzing a Monthly Chart for Trade Setups
- Step-by-Step Guide: Start by looking at the big picture the monthly chart offers. Look for major trends – are prices generally going up, down, or moving sideways? Identify key support and resistance levels where the price has repeatedly bounced or reversed.
- Identifying Patterns: Keep an eye out for well-known patterns like ‘head and shoulders’, ‘double tops’, or ‘bull and bear flags’. These patterns can signal potential future movements.
- Looking at Indicators: Use indicators like Moving Averages, MACD, or RSI on a monthly scale to understand the overall market sentiment.
Identifying Key Price Action Signals on a Monthly Chart
- Spotting Breakouts and Reversals: Look for moments when the price breaks through a long-standing trend line or resistance/support level. This could signal a major shift in the market.
- Candlestick Patterns: Pay attention to monthly candlestick formations. A series of bullish or bearish candles can give clues about market direction.
- Volume Analysis: Check how volume is behaving. An increase in volume on a trend breakout or reversal can confirm the strength of the move.
Integrating High Time Frame Analysis with Lower Time Frame Execution
- Combining Time Frames: Use your monthly chart analysis as a guide for what to look for on weekly or daily charts. If the monthly chart suggests an uptrend, look for buy setups on lower time frames.
- Refining Entry Points: Use lower time frames to fine-tune your entry. For example, if the monthly chart shows a bullish trend, use the daily chart to find the best entry point based on short-term retracements or consolidations.
- Managing Risk: Align your risk management with both time frames. Set stop-losses and take-profits based on the information from both the monthly and daily/weekly charts to balance risk and reward.
Using high time frame charts like the monthly chart helps you spot major trends and key levels. By combining this with lower time frame charts, you can find the best entry points and manage your trades more effectively.
Refining Setups with Weekly and Daily Charts
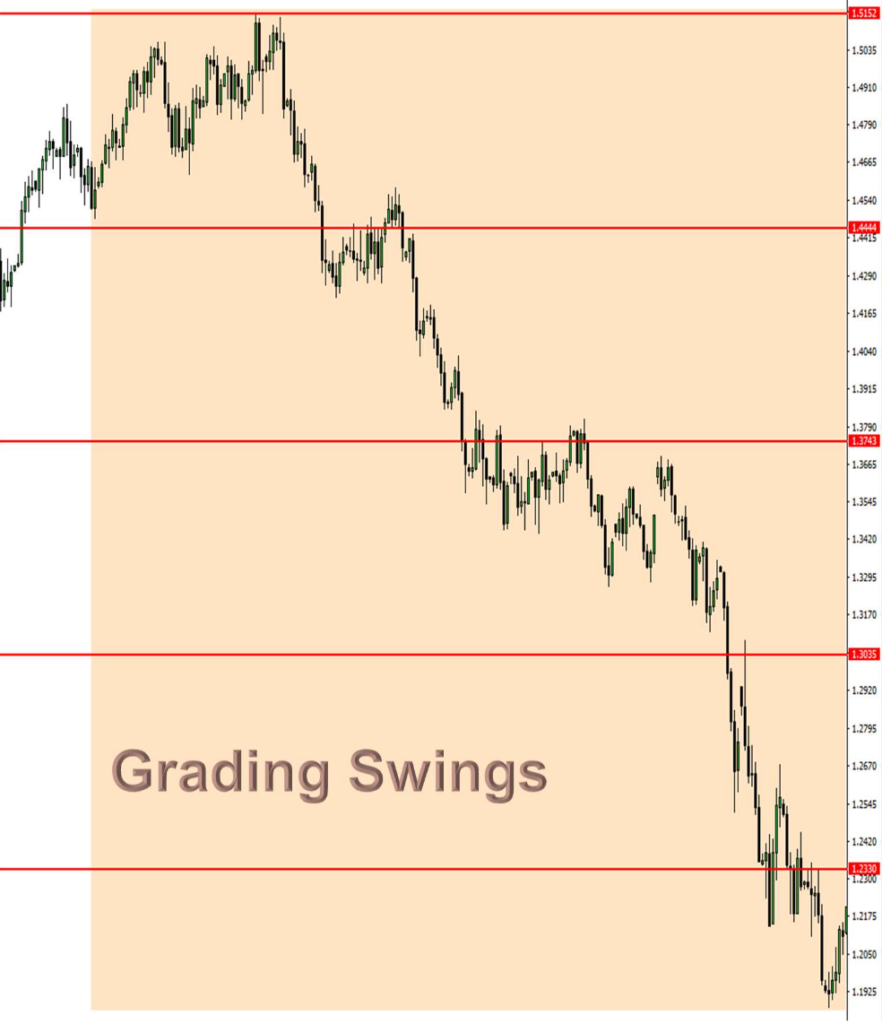
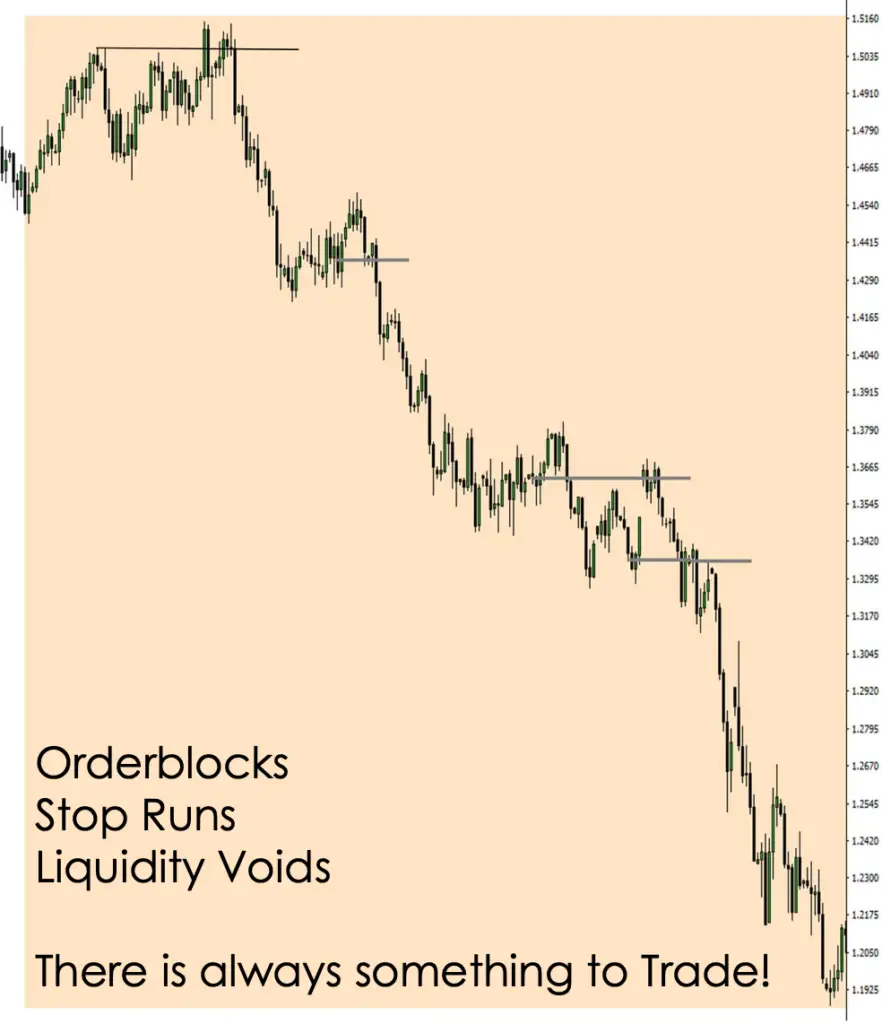
Breaking Down Monthly Chart Setups
- Weekly Chart Refinement: Use the weekly chart to break down the broader trends identified on the monthly chart. Look for smaller patterns or trends within the larger one for potential trade setups.
- Daily Chart for Precision: The daily chart is where you get precise. It helps you pinpoint the exact entry and exit points within the broader trend identified in the monthly and weekly charts.
Identifying Trade Opportunities
- Optimal Trade Entries: Look for points where the price action gives you the best risk-to-reward ratio. This could be pullbacks in a trend or breakouts from a consolidation pattern.
- Order Blocks: Identify areas where big players might have entered the market. These can be key levels where the price might react strongly.
- Stop Runs: Watch for price moves that seem to target common stop-loss levels, only to reverse soon after. This can indicate a false breakout and a potential trade opportunity.
Conclusion
To wrap up:
- Picking the right time frame, like monthly, weekly, or daily charts, is really important in trading. It helps you see the market in different ways.
- It’s also key to have your own trading setups. This means knowing when you want to enter and leave a trade.
- Using big time frame charts gives you a big picture, and then using smaller time frames, like weekly or daily, helps you make the actual trades.
- Trading is personal. Your way of trading should fit you and how you like to trade.
- Keep learning and adjusting your trading. The market changes, and your trading can too.
Find your way of trading and keep working on it. That’s how you can do well in trading.

These contents are really good Micheal
Give us more