Introduction
Welcome to our second lesson in the November series, marking the third month of our insightful ICT mentorship program. Today, we delve into the intriguing world of institutional order flow, focusing on how to identify and understand it with ease.
In this lesson, we build upon the foundations laid in our previous session. We’ll revisit the Euro Dollar example used earlier, providing a practical and real-world context to our discussion. This approach will help us explore the nuances of institutional order flow – a crucial aspect for any trader aiming to grasp the deeper movements in the market.
Understanding institutional order flow is not just about recognizing patterns on a chart; it’s about comprehending the significant market forces behind these movements. By the end of this lesson, you’ll have a clearer picture of how big players influence market trends and how you can align your trading strategies to these insights for better decision-making. Let’s dive in and uncover the secrets of the market’s flow.
Understanding Order Blocks
In the world of trading, especially when analyzing the currency markets, understanding the concept of ‘Order Blocks’ is crucial. This concept was introduced in our previous lesson, and we’ll delve deeper into it using the Euro Dollar example as a case study.
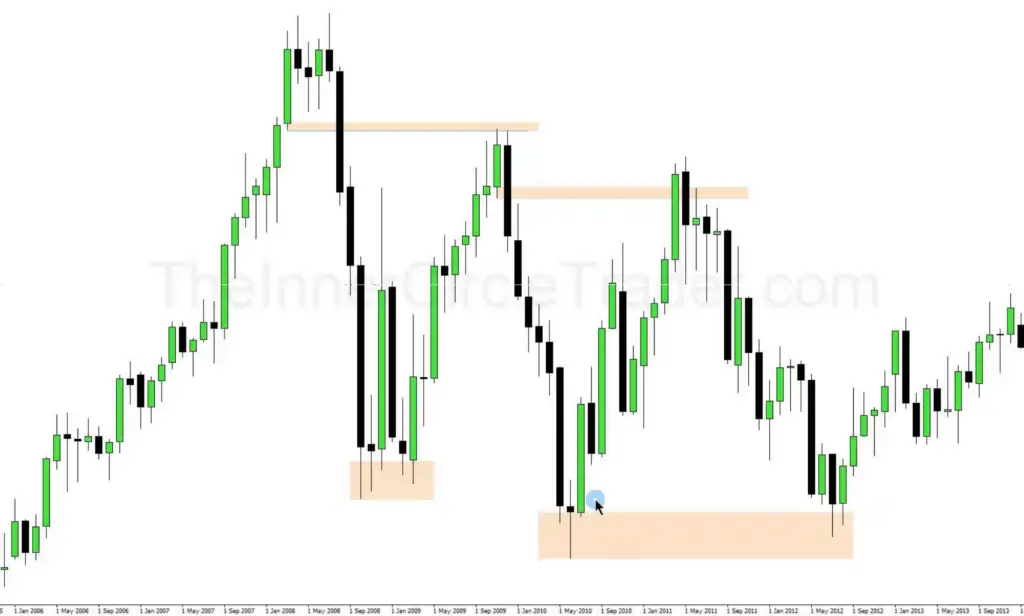
Analyzing Order Blocks from Lesson One
- An order block is essentially a significant price level or range identified from previous trading periods. It indicates where substantial buying or selling occurred.
- In our Euro Dollar example, we’ll examine a specific order block, focusing on how it influenced the currency pair’s movements.
Detailed Examination of Open, Low, and High Figures
- To truly grasp the essence of order blocks, we need to look closely at the open, low, and high figures within a specific time frame.
- For the Euro Dollar, we’ll analyze these figures and understand how each plays a role in the formation and relevance of order blocks.
- The ‘open’ figure tells us where the price started at the beginning of the period, while the ‘high’ and ‘low’ provide the extremes of price movement during that time.
Significance of These Figures on a Monthly Chart
- When studying these figures on a monthly chart, their significance becomes even more pronounced. The monthly chart provides a broader view of the market, capturing longer-term trends and sentiments.
- The high, low, and open figures on a monthly chart can pinpoint areas where institutional traders likely made significant moves, influencing the market’s direction.
- By understanding these key figures and how they form order blocks, traders can anticipate potential areas of support or resistance in the future.
In essence, the analysis of order blocks involves dissecting past price movements to predict future market behavior. This method is not about precision but about identifying areas where the market has shown significant interest, making it a valuable tool for any trader’s arsenal.
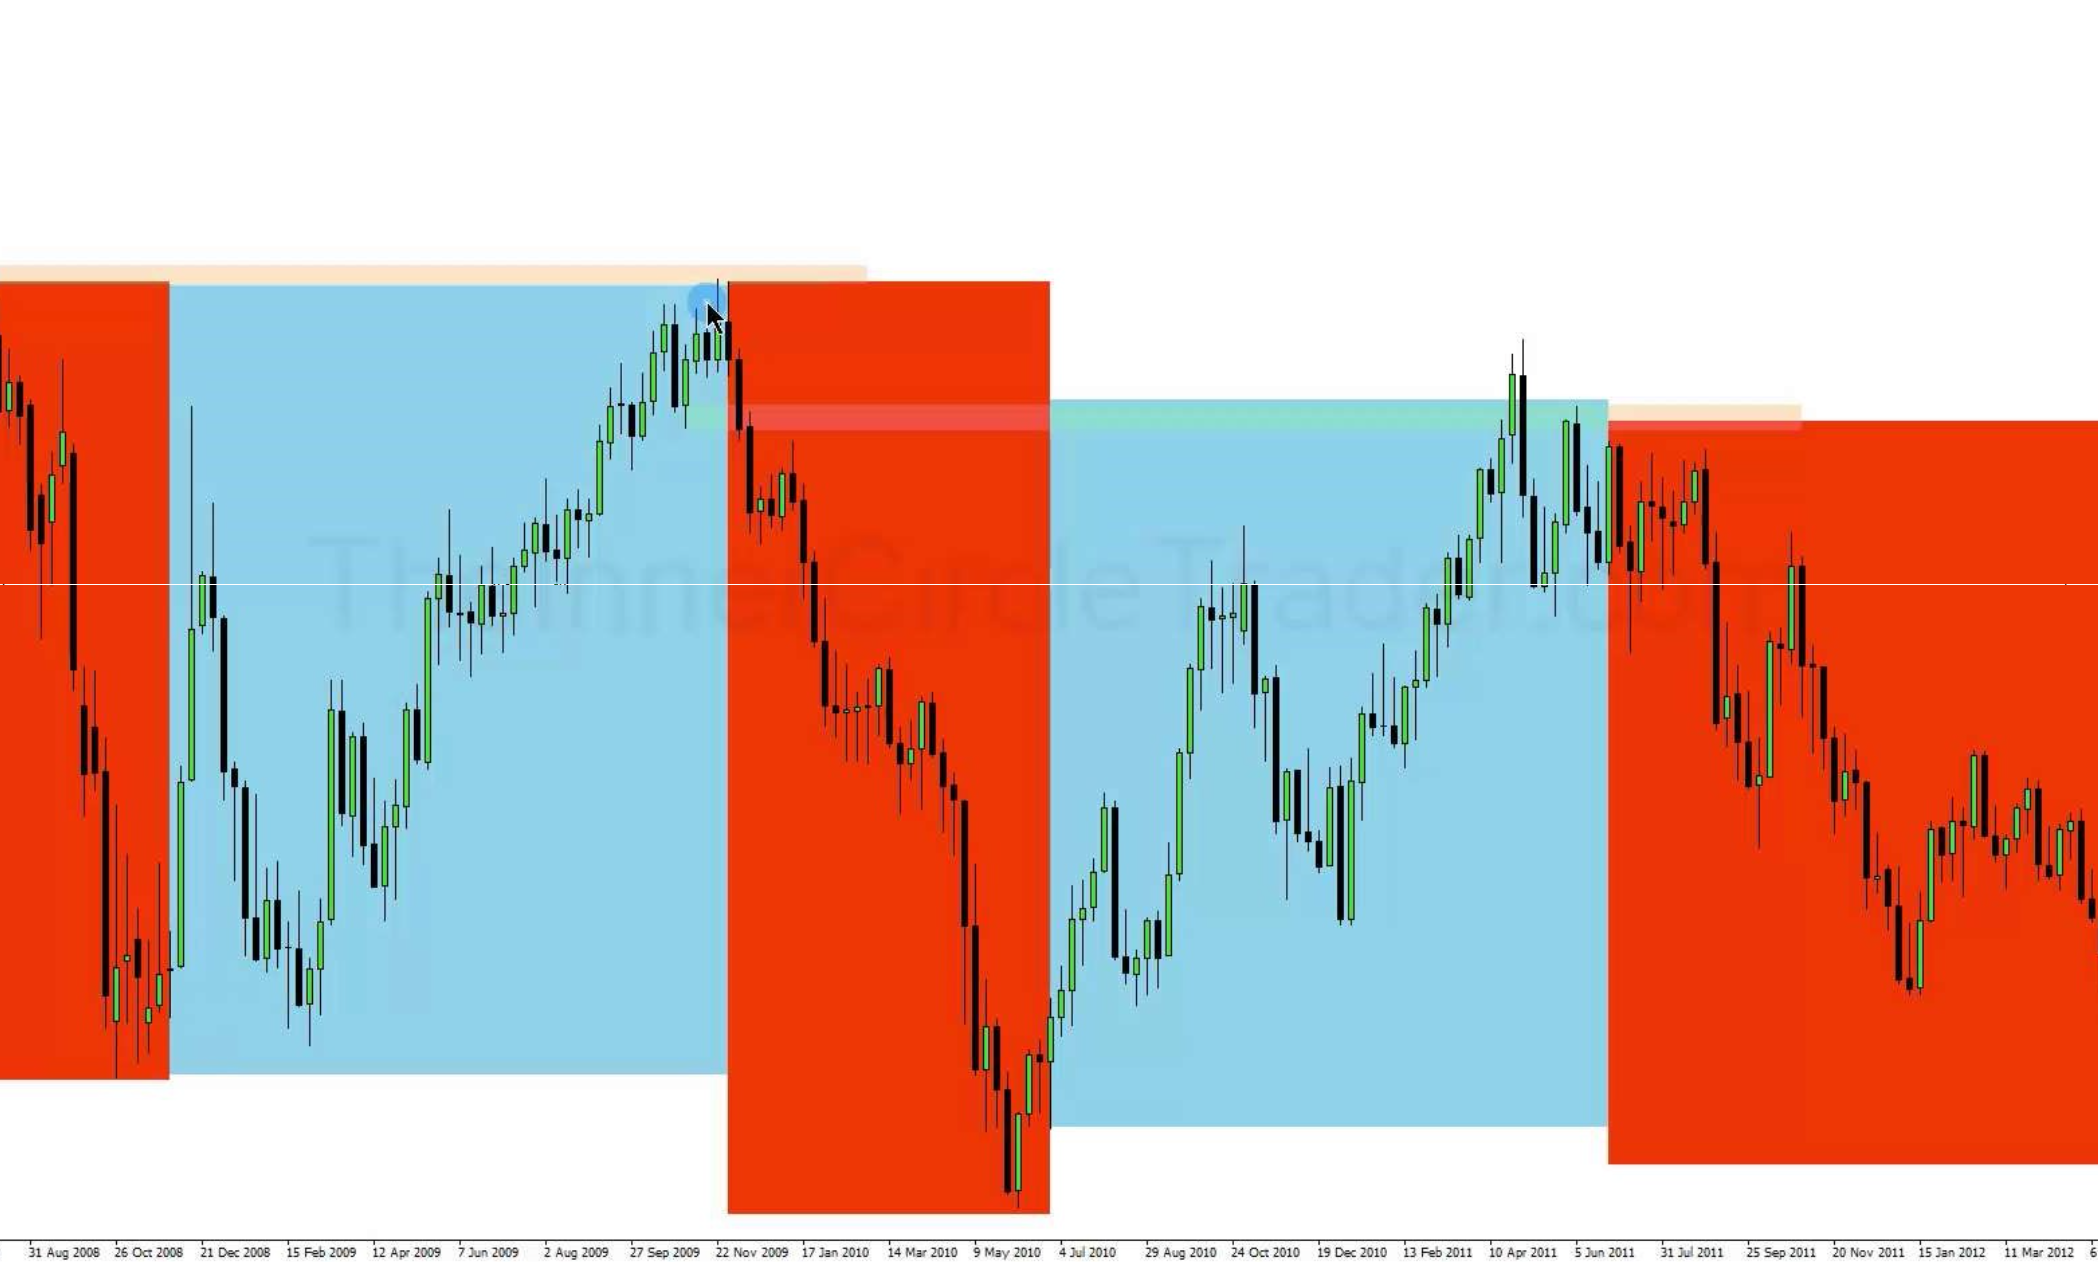
Institutional Order Flow on Monthly Charts
Understanding institutional order flow on monthly charts is a powerful technique for traders. It involves analyzing broader market trends to anticipate future scenarios. Here’s how it’s done:
Anticipating Market Scenarios Based on Monthly Chart Analysis
- Long-term Trend Analysis: Monthly charts provide a macroscopic view of the market. By studying these charts, traders can identify long-term trends, which are often driven by institutional movements.
- Scenario Planning: Based on these trends, traders can develop scenarios for potential market movements. This helps in preparing strategies for different market conditions.
The Role of High and Low Points in Determining Market Direction
- Significance of Extremes: The highest and lowest points on a monthly chart are crucial. They often represent significant levels where institutional traders have entered or exited the market.
- Directional Cues: These points can offer clues about the market’s future direction. A monthly high breaking can signal a bullish trend, while breaking a monthly low might indicate bearish momentum.
Ignoring Wicks and Focusing on Candle Bodies for Accurate Analysis
- Understanding Market Noise: Wicks on candlesticks represent price extremes within a period but can often be just market noise. Focusing too much on them can lead to misinterpretation of market sentiment.
- The Relevance of Candle Bodies: The body of a candlestick, showing the open and close prices, provides a more accurate picture of market sentiment. It reflects the price range where most trading activity happened.
- Real Market Movements: By concentrating on candle bodies, traders can better understand real market movements and ignore misleading spikes or dips represented by the wicks.
Market Efficiency and Liquidity
To navigate the trading landscape effectively, it’s crucial to understand the concept of market efficiency and liquidity. This understanding can significantly enhance a trader’s ability to make informed decisions.
Understanding the Market Maker’s Perspective and Seeking Maximum Liquidity
- Role of Market Makers: Market makers are entities or individuals responsible for maintaining a fair and orderly market. They facilitate trading by always being ready to buy or sell at publicly quoted prices.
- Seeking Liquidity: Their primary goal is to find areas in the market with maximum liquidity. High liquidity areas are where large volumes of trades can be executed without significantly impacting the market price.
Analyzing How the Market Rebalances after Trading Higher or Lower from Specific Points
- Rebalancing Mechanism: After significant moves up or down, markets often go through a rebalancing phase. This involves adjusting to the new price levels and finding equilibrium.
- Role of Highs and Lows: High and low points act as benchmarks for this rebalancing. These points often attract the attention of market participants, leading to increased trading activity and liquidity near these levels.
Identifying Where Liquidity Voids and Market Inefficiencies Exist
- Liquidity Voids: These are areas where there is a lack of market activity. They can lead to more significant price movements due to the lack of counteractive trading volume.
- Spotting Inefficiencies: Market inefficiencies are often found near these voids. They occur when the market price does not fully reflect all available information, often due to the lack of liquidity.
- Strategic Trading: By identifying these inefficiencies and voids, traders can strategize to take advantage of potential mispricings or prepare for sudden price movements when the market moves into these areas.
Price Movement and Institutional Order Flow
Grasping the relationship between price movement and institutional order flow is essential for traders who aim to align their strategies with the major forces driving the market.
How Price Movements Indicate Institutional Order Flow Directions
- Tracking Large Movements: Big shifts in price often indicate institutional activities. When large institutions buy or sell, their sheer volume can lead to significant price movements.
- Understanding Trends: Continuous trends, especially those on higher time frames, can often be attributed to sustained institutional interest, either in buying or selling.
Recognizing Patterns Where the Market Seeks Liquidity and Responds to It
- Liquidity Pools: Institutions often target areas where there are significant liquidity pools – places where retail stop losses or unexecuted orders are clustered.
- Pattern Recognition: Certain patterns, like rapid price spikes or deep retracements, can signal institutions taking advantage of, or contributing to, these liquidity pools.
Learning to Differentiate Between Retail and Institutional Volumes in Price Charts
- Volume Analysis: High volume bars on a chart can indicate institutional activity, as retail traders typically don’t have the capacity to generate such volume.
- Price Action Cues: Sharp, decisive moves in price, especially after periods of consolidation, can often be the result of institutional trading. In contrast, choppy, directionless markets may indicate a lack of institutional interest.
- Candlestick Analysis: Large-bodied candles with small wicks can suggest institutional buying or selling, whereas candles with large wicks and small bodies might indicate retail market indecision.
Translating Monthly Insights into Weekly and Daily Trades
Successfully trading in the financial markets often involves distilling broader market trends observed on monthly charts into actionable strategies on weekly and daily timeframes.
Breaking Down Monthly Chart Insights
- From Macro to Micro: The first step involves translating the broad trends and key levels identified on monthly charts into more granular insights. This helps in understanding how these large trends are unfolding in the shorter term.
- Identifying Sub-Trends: Often, the monthly chart’s main trend is made up of smaller trends and patterns observable on weekly or daily charts. Recognizing these can provide numerous trading opportunities.

Understanding Weekly Charts for a Finer Perspective
- Bridging the Gap: Weekly charts act as a bridge between the macro (monthly) and micro (daily) views of the market. They offer a more detailed view of the market’s direction and key turning points.
- Spotting Intermediate Trends: These charts are ideal for identifying intermediate trends and retracements which may not be visible on monthly charts but are crucial for short-term trading strategies.
Using Daily Charts for Precision in Entry and Exit Points
- Fine-Tuning Entry and Exit Points: Daily charts allow traders to pinpoint precise entry and exit points. By zooming into the daily timeframe, traders can identify specific patterns and candle formations that signal optimal trade timings.
- Aligning with Institutional Flow: The daily chart provides clarity on how institutional order flow is influencing price movements on a day-to-day basis. This helps in aligning trades with the prevailing institutional sentiment.
- Risk Management: The granularity of daily charts aids in better risk management, allowing for tighter stop losses and more precise take profit levels based on the most recent market movements.
Practical Application and Examples
Applying the concepts of institutional order flow to real trading scenarios is crucial for practical understanding. Let’s dive into a detailed example using the Euro Dollar currency pair, focusing on how to identify and trade based on bearish and bullish order blocks and recognize liquidity-seeking behavior in the market.
Detailed Walkthrough Using the Euro Dollar Example
- Study of the Euro Dollar Pair: Take a specific period on the Euro Dollar chart, preferably one that shows clear trends or significant price movements.
- Analysis of Highs and Lows: Identify the highest and lowest points during this period. These points are often where institutional order blocks are formed.
- Observation of Price Reactions: Notice how the price reacts when it returns to these high and low points. A strong reaction away from these points can validate the presence of an order block.
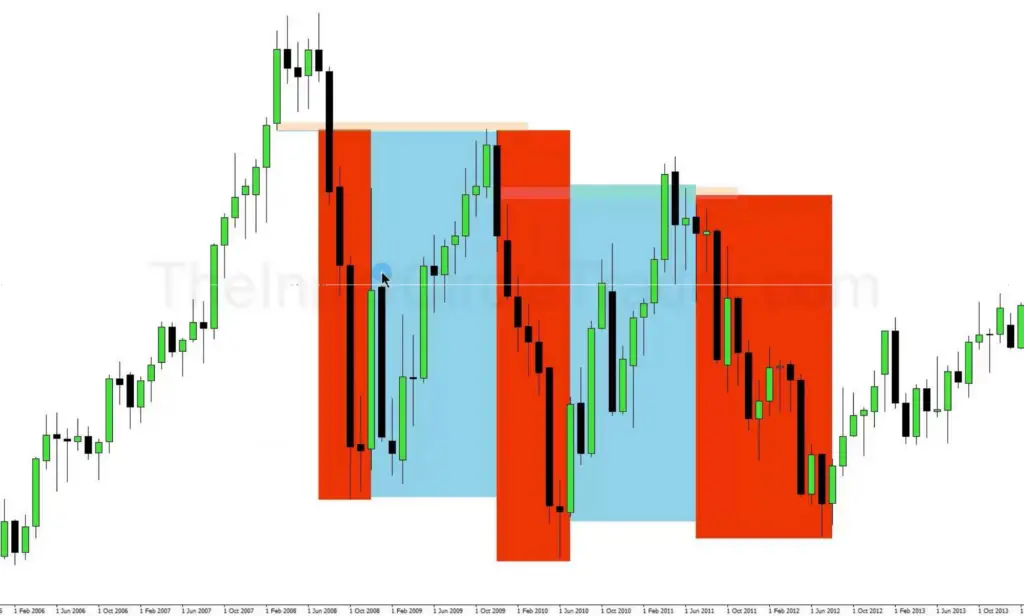
Identifying and Trading Based on Bearish and Bullish Order Blocks
- Bearish Order Blocks: These are typically found after a significant price drop. They are marked by a consolidation or minor pullback before the price continues to drop. When the price returns to this block, it’s an opportunity to enter a short position.
- Bullish Order Blocks: These are seen after a notable price rise, characterized by a brief period of consolidation or pullback, followed by a continued upward movement. A return to this block is a potential signal to go long.
- Trade Execution: Enter trades as the price returns to these order blocks, setting stop losses just outside the block to protect against false breakouts.
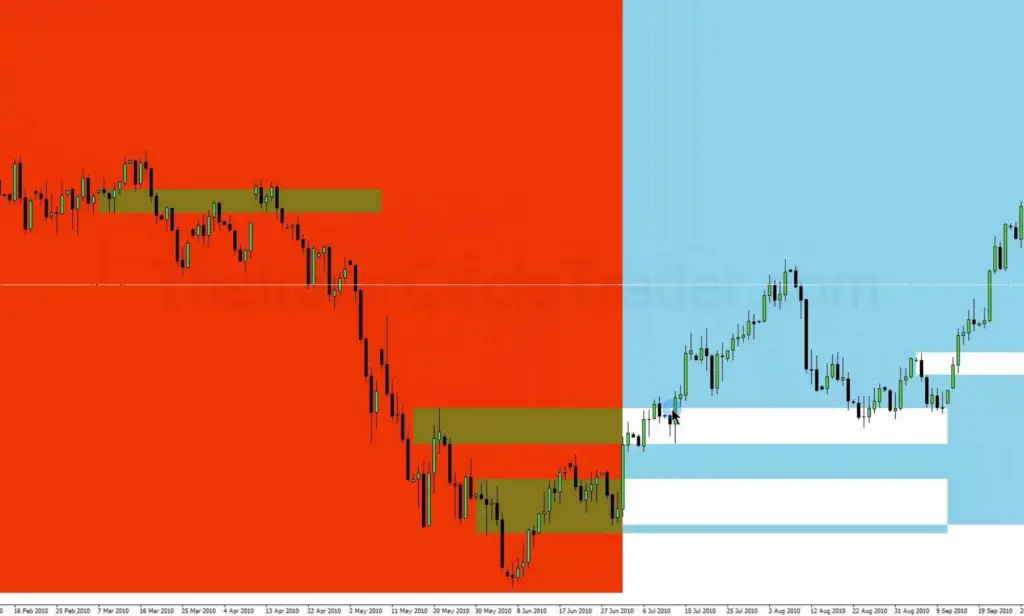
Recognizing and Capitalizing on Liquidity Seeking Behavior
- Identifying Liquidity Pools: Look for areas where retail stop losses might cluster, such as just beyond recent highs or lows.
- Market Reactions to Liquidity Pools: Watch for sudden and sharp price movements into these areas, which may indicate institutions triggering these stops to enter or exit positions.
- Capitalizing on the Move: Once you identify a potential liquidity run, you can trade in the direction of institutional flow. For instance, if the price sharply drops to trigger stop losses and then starts to rise, you might enter a long position anticipating further upward movement.
Conclusion
To sum up what we’ve learned:
- We looked closely at how big traders move the market, especially with the Euro Dollar example.
- We saw how to spot and use bearish and bullish blocks. These are places where prices went up or down a lot before, and they can tell us what might happen next.
- We also learned about liquidity. This is about understanding where a lot of trades might happen and using that info to make good trading choices.
Remember, trading is about watching the market, seeing what the big players are doing, and using that to decide when to buy or sell. What we covered today should help you see these patterns and use them in your trading. Keep practicing these ideas, and they can really help you understand and do better in trading.
Awesome